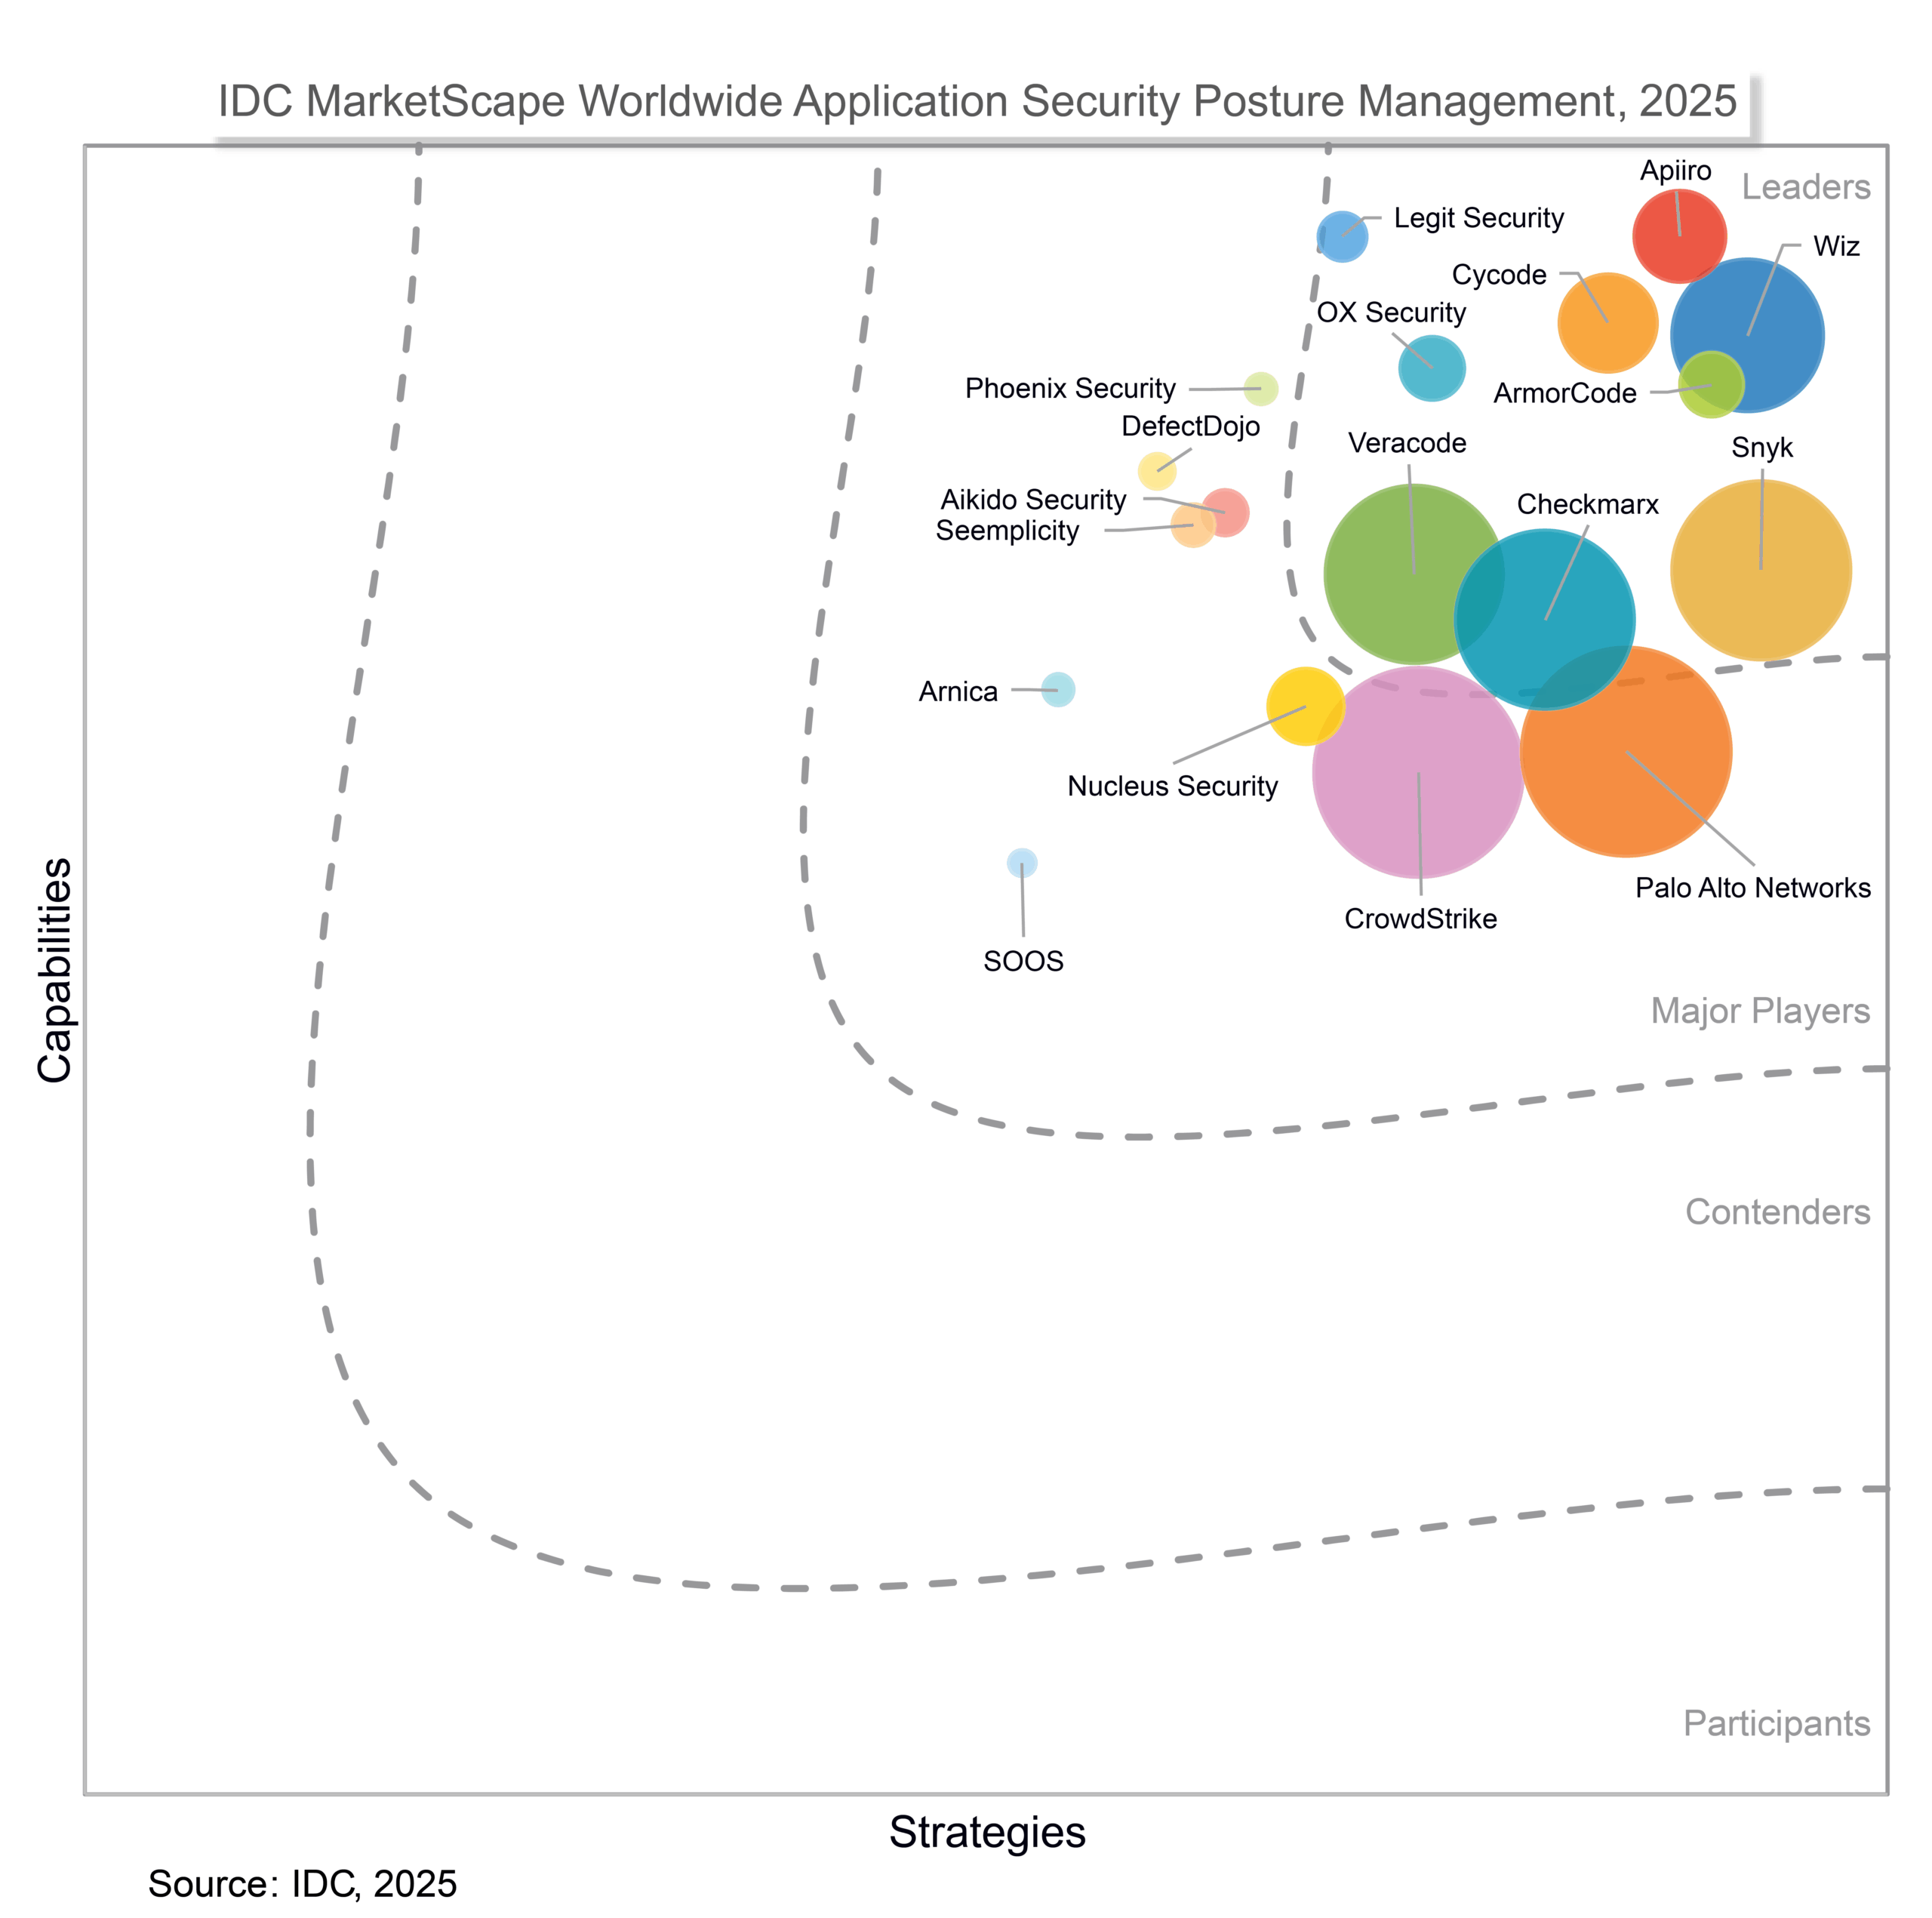
Veracode Recognized as a Leader in the 2025 IDC MarketScape for Application Security Posture Management (ASPM)
In the inaugural IDC MarketScape report on the ASPM market, Veracode has been named as a Leader—highlighting some of Veracode’s key strengths, including:
- Risk Reduction Optimized for Remediation Efficiency
- Open Ingestion Strategy Beyond Native Scanning
- Contextual Dashboards with Repo-to-Runtime Traceability
Veracode Risk Manager (VRM) serves as a comprehensive ASPM platform that provides unified visibility and coordinated remediation of application security risks. VRM addresses the challenge of fragmented tooling by aggregating findings from over 50 sources across code, cloud, infrastructure, and security systems. Once ingested, data is normalized and correlated with asset and business context to surface prioritized issues and recommend targeted remediation actions for efficient risk reduction.
“Customers report improved security posture after adopting Veracode’s ASPM platform, citing better prioritization of risks, fewer misconfigurations in production, and clearer visibility into application security data. Users highlight strengths in data normalization, risk correlation, and remediation tracking, as well as satisfaction with deployment experience and customer support.” –Katie Norton, 2025 IDC MarketScape for ASPM, September 2025
© Copyright IDC
SOURCE: “IDC MarketScape: Worldwide Application Security Posture Management 2025 Vendor Assessment” by Katie Norton, September 2025, IDC # US53001925.
IDC MarketScape vendor analysis model is designed to provide an overview of the competitive fitness of ICT suppliers in a given market. The research methodology utilizes a rigorous scoring methodology based on both qualitative and quantitative criteria that results in a single graphical illustration of each vendor’s position within a given market. The Capabilities score measures vendor product, go-to-market and business execution in the short-term. The Strategy score measures alignment of vendor strategies with customer requirements in a 3-5-year timeframe. Vendor market share is represented by the size of the circles. Vendor year-over-year growth rate relative to the given market is indicated by a plus, neutral or minus next to the vendor name.