Towards a better risk score for open source security

You already know that SourceClear provides robust vulnerability detection to protect your code and your customers. However, when you’re overseeing multiple projects, it can be a challenge to know where to prioritize your resources. Even if you have just one project, you may want to know how that project stacks up against similar projects by other developers. That’s where our new project risk score comes in.
Our scoring mechanism calculates a score between 0 and 100 for every project based on the number of high, medium, and low risk vulnerabilities in that project. It indicates how risky the project is compared to all the other scanned projects in the SourceClear platform. You can see this project score on each Project Details page. Knowing this risk score for your projects helps you decide which projects to focus efforts on first.
This blog post describes how the distribution of vulnerabilities in open source is used as a basis to compute the score.
Basic Score Calculation
As previously mentioned, the project risk score reflects the overall risk compared to other projects. We analyse the distribution of each vulnerability risk level (high, medium, low). The distribution is used to calculate the basic score for each risk level. These are combined later to create an overall score. The figure below shows the distribution of each vulnerability risk level based on scanning the top 1000+ starred repositories on GitHub for each supported language.
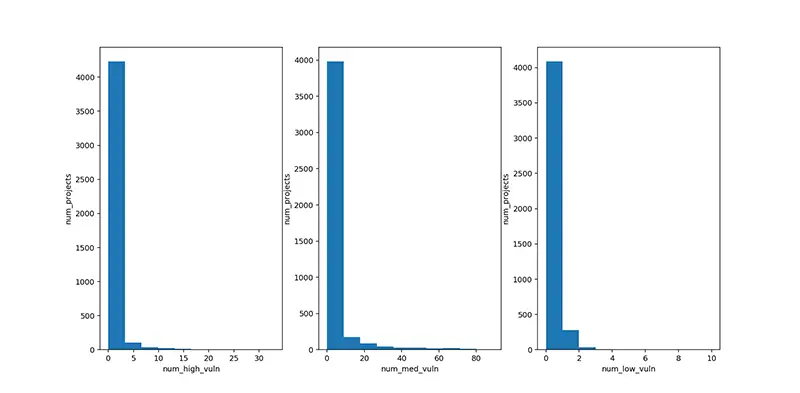
As we can see, most projects have no vulnerabilities and from then onwards, the number of projects with vulnerabilities decreases very rapidly. In fact, the curves for each of the risk levels is -log(x). Then we see where on each curve a particular project falls to find its score for high, medium, and low risk vulnerabilities.
For example, assume that a project has 5 high risk vulnerabilities, 0 medium risk vulnerabilities, and 0 low risk vulnerabilities., Looking at the curve above we can see that among the given 4000+ projects, fewer than 400 have 5 high risk vulnerabilities or more. Thus, the basic score for the high risk part of this project is over 90/100 (since only 10% of projects have more high risk vulnerabilities), while the basic score for medium and low is zero.
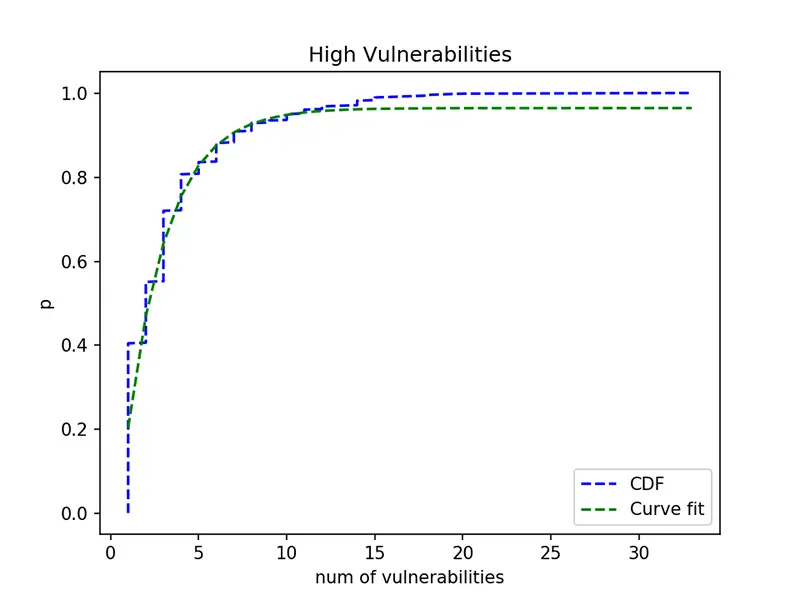
Obviously the above calculation of the basic score relates to the CDF (Cumulative Distribution Function) for each of these distributions, since the CDF directly gives us the percentage of projects that have at most a given number of vulnerabilities. To obtain the CDF for scoring, we fit a curve of the form Aexp(-Bx) + C over the CDF where x is the number of vulnerabilities. The fitted curve for high risk vulnerabilities is shown in green in the figure below, while the line in blue denotes the original CDF. The values of A, B, and C are inferred respectively for each high, medium, and low risk vulnerability curve and used for scoring.
Overall Score Calculation
Next, we show the calculation for the overall score. Basically, we use a linearly weighted formula to add up all the basic scores. Currently, the weights are always set to 1, but in future releases, customers may be able to set their own weights to—for example—give more importance to high risk vulnerabilities than low risk vulnerabilities, or to ignore low risk vulnerabilities completely.
Let us assume Fh(Nh), Fm(Nm), Fl(Nl) as the basic scores obtained from the CDFs for a scanned project with Nh, Nm, Nl as the number of high, medium, and low risk vulnerabilities, respectively, and Wh, Wm, Wl as the corresponding weights. The final score formulation is:
Score = Wh fh Fh(Nh) + Wm fm Fm(Nm) + Wl fl Fl(Nl)
where fh, fm, and fl are internal factors that we use to ensure a reasonable scoring system.
Summary
SourceClear already helps you know where your code has weaknesses. Our project risk score now helps you get a sense of how urgently to address these weaknesses to help you prioritize your team’s work. The score is based on distributions of high, medium, and low severity vulnerabilities in a large sampling of scanned projects and then combined to provide an overall score which you can see in the webapp on the Project Details page. We hope you find this useful.
Related Posts