Security statistics are complicated, and there’s a lot of fog of war around some fundamental questions like: how common are SQL Injection flaws? A pair of interesting articles over the last day have illustrated some of the challenges with answering that question.
A company called DB Networks announced that it had found an uptick in SQL Injection prevalence in 2014, which had appeared to be on a steady decline from 2010 to 2013. DB Networks based their analysis on data from the National Vulnerability Database, which collects disclosures of known vulnerabilities. Shortly thereafter, Jericho from Attrition.org, a noted security commentator, called out DB Networks for deficiencies in their methodology (in short: upticks in disclosures don’t mean an uptick in vulnerabilities; CVEs may cover multiple vulnerability categories; and so forth). Jericho closed his article saying “I encourage companies and individuals to keep publishing vulnerability statistics. But I stress that it should be done responsibly.”
In the spirit of Jericho’s challenge, I thought it would be worthwhile to talk about the prevalence that we see for SQL Injection in our own application data set. In short: we don’t see what DB Networks saw, but the answer of “is the problem getting better” is complicated and depends on the method used to find the flaws, whether the app is being scanned has been scanned before or is being seen for the first time, and other factors.
Taking advantage of our single cloud-based platform with its end-to-end array of application security capabilities, our data set consisted of over 50,000 applications that were scanned one or more times by Veracode between the years 2012 and 2014, using a variety of analysis techniques. In this analysis, an “application” is defined as a set of compiled code (binary or bytecode) that was uploaded to Veracode’s cloud-based platform by a customer for a static scan; a single web host identified by the user for an authenticated or unauthenticated dynamic scan; an application scope identified by the customer for a manual penetration test; or in some cases a combination of two or three of these.
Since the goal was to look at prevalence, we further restricted the definition of the data set that we were looking at to include only the customer’s “first scan” with us; that is, the first time Veracode performed that type of scan for that application on the customer’s behalf. This was to eliminate any effect introduced by the security program’s systematic risk reduction effort on these applications.
What we found was that, in aggregate, 20.2% of all applications scanned, or just over 1 in 5, had at least one SQL injection vulnerability identified by static, dynamic, or manual scans during the period in question. By scan type, 31.4% of the applications that had a static scan had at least one possible SQL injection vulnerability identified; 6.1% of those that had a dynamic scan had at least one possible SQL injection vulnerability; and 8.2% of those that underwent a manual penetration test had a SQL injection vulnerability.
Figure 1: Overall SQL Injection Prevalence by Scanning Type
| Scanning type | % applications vulnerable to SQL injection on first scan |
| Overall | 20.2% |
| Static | 31.4% |
| Dynamic | 6.1% |
| Manual | 8.3% |
Why the differences between scan types? It comes down to the difference between static and dynamic testing. Veracode’s static scanner looks at all executable code paths for vulnerable code constructs that could potentially be used by an attacker; our dynamic scanner executes non-destructive tests to look for a signal that a SQL injection vulnerability exists, similarly to the way a manual penetration tester would approach the problem. Dynamic scanner findings are more likely to be exploitable, but because the dynamic scanner must execute the application to find the flaw, it may be limited by the amount of time provided or the ability of the scanner to get to the vulnerable part of the application by clicking through the application UI or exercising back end interfaces. Of course, manual testing, driven by a human and sometimes “timeboxed” to a fixed period, is a less predictable process but may find vulnerabilities that are missed by other approaches.
What about trends? Due to differences in scan methodology, I looked at trends by scan type, rather than overall application prevalence trends. Here there were some clear differences. With manual, we saw a drop from 2012 to 2014 of around 4.7% in prevalence. Dynamic bounced around a little but showed a net increase from 2012 to 2014. For static, there was a decline of about 1% -- probably statistically significant, given the size of the sample, but not as dramatic as with manual.
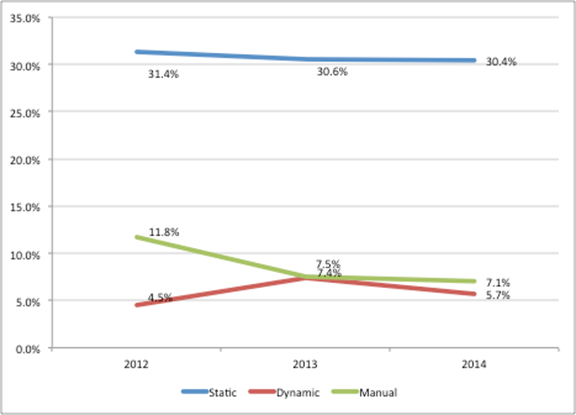
Figure 2: SQL Injection Application Prevalence Trends
So, over a large data set, using three different testing methodologies, we can see a decrease in SQL injection prevalence in two, and some disagreement in the third. But what explains the drop? Here I depart from the bare facts and provide an interpretation based on general trends as well as specific actions taken by Veracode’s customer base.
First, breaches over the last several years have raised awareness of the importance of SQL Injection as an attack vector. As a result, the security industry has focused awareness on SQL injection via inclusion in standards such as the OWASP Top 10 and the CWE/SANS Top 25.
Second, Veracode has seen its customers focus their policies on the eradication of higher severity vulnerabilities, including SQL Injection. Many Veracode customers focus on the creation of a policy that measures and eliminates Very High or High severity flaws (in Veracode’s standard scoring system, SQL Injection rates a High severity) rather than holding developers accountable for fixing every flaw found. (A discussion of Veracode customer policies may be found in Veracode’s State of Software Security Report, Vendor Testing Feature). I believe this may be partly responsible for the decline in SQL Injection prevalence year over year.
What explains the difference in the rate of drop between static and the other two methods? One thing we’ve seen is that customers sometimes take dynamic and manual findings more seriously because they seem “more real.” While it’s true that a finding on a running system has a higher probability of being exploitable than the average finding through static analysis, it’s worth remembering the difference in development stage (much later) and coverage (much lower) of these two methods compared to static analysis. More subtly, there is a higher cost to get to the point of a demonstrable vulnerability, not only in effort but also in time, compared to finding a vulnerable point in someone’s code – then pointing to the exact line where the fix needs to happen. We think all three testing methods are important, but it’s good to be aware of the tradeoffs.
A last note: it’s premature to celebrate the end of SQL Injection. Not only do the dynamic stats suggest that the decline may not be completely real, but the rates of decrease suggest the end will be years away, if it ever comes. But in this area, any sign of hope is worth pursuing. It’s also worth thinking about how we can accelerate progress in systematically going after SQL injection.

