State of Software Security 2017
The State Of Software Security Today
LETTER FROM
Chris Wysopal
VERACODE
CO-FOUNDER & CTO

In May 1998, the members of the L0pht Heavy Industries hacker collective sat before a U.S. Senate panel to warn the nation and the world about the inherent insecurity of software. Since then, software has become even more ubiquitous in our daily lives, controlling the devices and applications that are the lifeblood of modern commerce, the digital economy, and our critical infrastructure. As a result, cyberattacks are more far-reaching and consequential than we could have imagined 20 years ago – or even 12 years ago, when myself and fellow L0pht member Christien Rioux founded Veracode.
Yet, despite the promising, and necessary, growth in application security testing over that time, applications are no more secure today than they were a decade ago. Over the past year, our scans of thousands of applications and billions of lines of code found a widespread weakness in applications – a top target of cyberattackers. Three in every four applications had at least one vulnerability on initial scan, and 12% of applications had a high or very high severity vulnerability on initial scan. Less than a third of applications passed OWASP policy on the initial scan. And as the security skills gap grows, we’re seeing the same coding errors cropping up at similar rates, year after year. These discouraging statistics actually represent an optimistic view, because so many applications are not being assessed for security at all. If that weren’t concerning enough, the stakes continue to rise.
We're seeing the same coding errors cropping up at similar rates, year after year.
This edition of the State of Software Security report comes at a crucial moment in history. The unprecedented cyberattacks on elections in the U.S. and other democracies over the past year demonstrate that our most critical systems and the very foundation of our society are in the cross-hairs. Global cyberattacks on a massive scale, such as the WannaCry and Petya ransomware attacks, have brought our past warnings to reality. The earlier predictions of cyberattacks knocking out electric utilities have proved to be not just possible, but increasingly likely. And the threat of a cyberwar between nation states, potentially with damages similar to wars fought with kinetic weapons, gets closer with every provocation.
This should create a sense of urgency to finally tackle the problem of insecure software. Yet, conventional wisdom in security circles has drifted away from prevention in recent years towards detection and response. A reactive approach would utterly fail to stop the destruction of the WannaCry and Petya attacks. And it will fail more tragically in the face of the more powerful destructive attacks we’re likely to see in the future. Clearly, as I spoke about 20 years ago to the U.S. Senate, prevention should be the main answer.
This report is intended to further our goal of securing the world’s software, by sharing the uniquely vast and diverse data we are able to analyze within our cloud-based platform. What’s so valuable about the State of Software Security report is that we can plot trends over time, benchmark performance, and identify best practices. With the richness and broad scope of the data in this report, you can draw your own conclusions, and take away lessons to improve your own application security program – whether you’re looking to take another step up in your security posture, or taking your first step in the right direction.
Safe coding everyone.

Executive Summary
Click to Close ▲

Vulnerabilities continue to crop up in previously untested software at alarming rates. 77% of apps had at least one vulnerability on initial scan.

The top 10 list of most common vulnerability categories in 2017 is strikingly similar to 2016. Information leakage was again the most prevalent, present in 66% of apps on initial scan.

Organizations wisely prioritize the most dangerous vulnerabilities first.
The fix rate of high and very high severity vulnerabilities (37%) was about twice the overall fix rate (19%).


Even the most severe flaws take a long time to fix. Only 14% of very high severity flaws were closed in 30 days or less.

Government organizations continue to underperform those in other industries and had the highest prevalence of highly exploitable vulnerabilities like cross-site scripting (49%) and SQL injection (32%).

Most open source components remain unpatched once they’re built into software. 88% of Java applications had at least one flaw in a component.

Operations has to play a role in securing production applications.
25% of sites were running on web servers containing at least one high-severity vulnerability.


Application security (AppSec) testing makes a difference. OWASP pass rate improved by 13% from first scan to last scan.

Developer training has an essential role in reducing flaws. eLearning improved developer fix rates by 19%; remediation coaching improved fix rates by 88%.

Long-running programs perform best. Programs that have been around for 10 years had a 35% better OWASP pass rate than programs in place for a year or less.

DevOps accelerates AppSec’s incremental gains.
DevOps organizations that tested frequently with sandbox scanning had a 48% better fix rate than those doing policy-only scanning.
Veracode presents the eighth volume of the State of Software Security (SOSS) report, the application security industry’s most comprehensive review of application testing data. The metrics presented here are based on real application risk postures, drawn from code-level analysis of nearly 250 billion lines of code across 400,000 assessments performed over a period of 12 months between April 1, 2016 and March 31, 2017.
Deep analysis of our scan data creates a clear picture of application risk.
Our goal is to provide security practitioners with solid application security benchmarks to measure their own programs against. This year's report is bigger and better than ever. Our analysis goes deeper into data around software risk throughout the entire software development lifecycle. This includes information about the security pass rate of applications before and after remediation, the effect long-term security programs have upon that rate, the average fix rate and vulnerability close rate, as well as the statistical mix of common vulnerability types found in applications before and after remediation. In particular, we bulked up our analysis around how effectively organizations are prioritizing the most severe vulnerabilities and how quickly they're addressing these flaws.
The Data
Data for the State of Software Security 2017 is derived from scans conducted by Veracode’s base of 1,400+ customers, over the 12 month period from April 1, 2016 to March 31, 2017.

KEY STATS

400,000
total scans

250 billion
lines of code

12.8 million
flaws found

10.9 million
flaws fixed
Also new this year is some additional contextual survey data to better explain statistics collected from customer activity.
While our anonymized statistics from customer testing have always provided a useful lens for exploration in our SOSS reports over the years, they've got their limits. They tell us what software security looks like at the beginning, middle, and end of testing. But they don't really offer us a ton of context about the hows or whys of the problems. And they're not able to provide even nominal clues that could help us understand how many applications haven't even entered the AppSec pipeline yet.
For that reason we invested in a number of probing surveys over the course of the last year to get into the heads of today's developer to understand the habits, motivations, and job expectations that impact the security of their code. The statistics from these added studies will hopefully provide an additional richness of context to the scanning data we're sharing in this year's report.
The addition of this survey data and the deeper analysis of our long-running SOSS statistics come together to create the clearest picture we've ever composed about the state of software security.
Watch: Veracode experts discuss major trends in the report
What is the overall state of software security?
If there's one overwhelming trend that weaves its way through this year's statistics, it is that we haven't reached peak AppSec yet.
In the good news-bad news dichotomy, the good news is that there are a number of maturing programs that are making steady progress on their vulnerability flaw density. The less palatable news is that these maturing programs are still in the minority of organizations both small and large, and even the most mature programs still have plenty of room to improve their application risk posture.
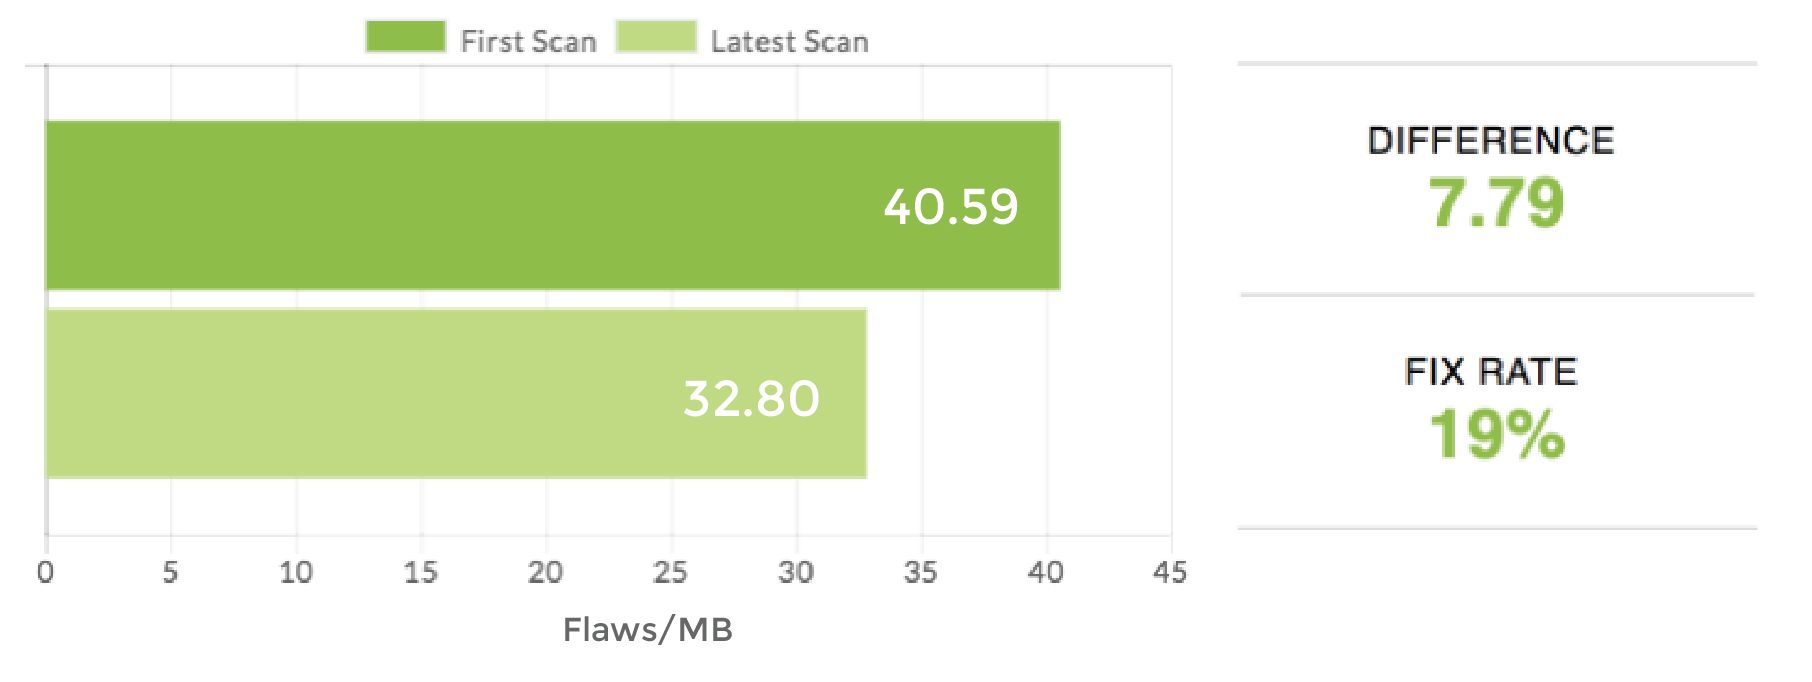
When looking at the overall fix rate we see that from first scan to latest scan over our year-long collection period, organizations are making statistical headway in the density of flaws per MB of code.
Overall Fix Rate
Additionally, when examining flaws found over the course of calendar year 2016, we saw that our customers closed more than half of them (58%) by the end of 2016.
Flaws Closed vs. Open
The speed at which organizations close flaws varies, but the bulk of closed flaws (49%) in 2016 took 90 days or longer to close. Interestingly, the second-most populous bucket of closed flaws were those it took less than eight days to close (16%). However, less than a third of closed flaws (31%) were closed in 30 days or less.
Closed Flaws
Days to close
Most importantly, when you take into account found flaws that remained open at the end of the measurement period (42%), only 29% of flaws were closed in less than 90 days, and 28% of flaws took more than 90 days to close. Given that industry studies find that most attackers are leveraging vulnerabilities within days of discovery, this statistic shows that there's a lot of work we still need to do in order to improve our vulnerability remediation processes.
Days to Close Flaws
Untested Software's Consistent Inconsistency
When organizations first scan their applications for vulnerabilities, they are bound to find flaws. Nevertheless, it's been our hope that in the better part of a decade that we've conducted research into vulnerability prevalence we'd see at least a little bit of improvement on the raw state of software before security scanning.
In theory, the growing awareness of security within the developer community should be prodding the overall body of coders to improve their daily best practices. This in turn should incrementally improve the initial pass rate of applications on the first security scan of any given app, right? Unfortunately, the stats don't bear that out.
As applications first underwent the scrutiny of software testing this year, approximately 70% of them failed security testing when measured against major industry vulnerability standards.
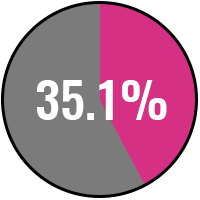
We saw a little year-over-year fluctuation in first scan pass rate. OWASP pass rates, for example, dropped by about eight percentage points from last year. This may be related to the types of companies that are starting to scan in this report, with a substantial percentage of retail, hospitality, and healthcare apps being scanned for the first time this year.
For the most part, though, the 70% failure rate is a consistent one that hasn't budged much in at least three years. The one silver lining to the trend line is that OWASP pass rates have improved by a statistically significant number compared to our initial data set in 2010.
OWASP Top 10 Policy Pass Rate
Percentage of Applications Passing on First Scan
But overall, the state of security awareness within the developer community remains such that the majority of developers are still making the same security-related mistakes out of the gate as they did several years ago.
Take SQL injection (SQLi) – a highly exploitable vulnerability, which is well-known in security circles. SQLi pops up at the start of scanning at a pretty consistent rate over the past several years, showing how developers continue to introduce common flaws into their code. In the past year, SQLi saw a slight dip since 2016, but the overall trend since 2011 didn’t fluctuate very much.
SQL Injection Trend
Percentage of Applications Affected
Poor performance at the start of testing is true not only for in-house enterprise software, but also commercial off-the-shelf software. In fact, commercially developed software tends to do worse than internally coded applications upon first scan.
Internally Developed vs. Third-Party (Commercial) Applications
Applications Passing OWASP Top 10 Policy
Later in the report we'll discuss in-depth some of the reasons pass rates remain stagnant on previously untested software. But the short version is that a lack of developer training in security makes testing and remediation of software a necessity, rather than a nice-to-have.
Getting Our Arms Around How Many Apps Remain Untested
Through our experience with enterprise AppSec, we at Veracode know implicitly that there remains a vast swath of applications in use today that have never been tested or scrutinized for security flaws in any way. Exactly how many applications have never been tested is a mystery, but we get some clues based on surveys we sponsored this year by ESG Research and Wakefield Research.
HOW MANY APPS AREN’T BEING TESTED?
36%
of organizations don't run any kind of SAST or don't know if they do
48%
of organizations don't run any kind of DAST or don't know if they do
83%
of organizations have released code before testing or resolving security issues
When mulling over the numbers from these surveys, it’s important to recognize that they don't show how many organizations are doing both static and dynamic testing, or neither type of testing. Still, while there are 64% and 52% of organizations that do some kind of dynamic or static testing, respectively, these organizations don’t necessarily test all of their apps. Most IT pros surveyed admit to having released code at some point without testing or resolving security issues. Furthermore, as we’ll discuss later in the report, many applications that are scanned are only scanned once – the median number of scans per application over the past year was just two.
Disconcertingly, testing also remains largely disconnected from the developer's normal daily workflow. As a result, fixes that would be simple to make while the developer is still working on a particular component turn into more costly rework when they need to backtrack later on.
SAST vs. DAST
Static Analysis Security Testing (SAST)
Examines code statically in a non-runtime environment.
Dynamic Analysis Security Testing (DAST)
Examines the application dynamically in a runtime environment, either live or in a pre-production environment.
Static and dynamic analysis offer different strengths at unearthing different kinds of vulnerabilities. For example, dynamic testing may be better at picking up deployment configuration flaws, while static testing might find SQL injection flaws more easily. The point is that neither test alone is sufficient for application security.
Untested Software and Breach Risk
We'll soon delve into greater detail about how the combination of testing and programmatic remediation efforts can improve the state of security within software. But first, let's continue to look at the performance data we have from initial scans, because it offers a window into how vulnerable untested applications are to a breach. If you aren't testing for security, these are the top 10 types of vulnerabilities that are inevitably lurking in your applications.
Top 10 Vulnerability Categories
Percentage of Applications With a Vulnerability on Initial Scan
We found that the same 10 vulnerability categories from 2016 were again in the top 10 in 2017, with very little movement in the prevalence ranking. Most categories in the top 10 saw a slight drop in prevalence from last year, except for credentials management, which ticked up slightly (41% in 2016 to 42% in 2017). This consistency in our data continues even as new customers come aboard. We already showed the static nature of the incidence in SQL injection flaws upon first scan. This consistency is found in other flaw categories as well.
Consistency Over Time
Percentage of Applications Affected
So how does this vulnerability prevalence translate to risk of breaches? We may not have one-to-one risk breakdowns for how likely each type of flaw is to be exploited in an attack. But all of these vulnerabilities have been connected to at least one high-profile breach or attack discovery over the past year.
A Closer Look at the Top
10 Vulnerabilities
Click to Open ▼
Information Leakage Trend
Percentage of Applications Affected
Cryptographic Issues Trend
Percentage of Applications Affected
Code Quality Trend
Percentage of Applications Affected
CRLF Injection Trend
Percentage of Applications Affected
Directory Traversal Trend
Percentage of Applications Affected
Credentials Management Trend
Percentage of Applications Affected
Cross-Site Scripting Trend
Percentage of Applications Affected
Insufficient Input Validation Trend
Percentage of Applications Affected
SQL Injection Trend
Percentage of Applications Affected
Encapsulation Trend
Percentage of Applications Affected
Incrementally Improving Software Security Through AppSec Programs
The data on previously untested software makes a good case for regular testing and remediation of flaws. But initial scan data is only one element of assessing the risk readiness of an organization. Those in our sample set making the initial scan are taking only their first step in an ongoing process.
So what does that progress look like? The best one-word description is “incremental.”
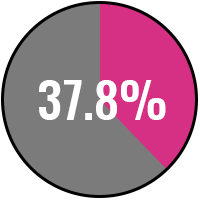
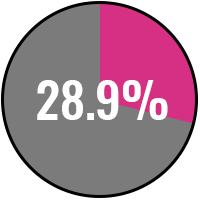
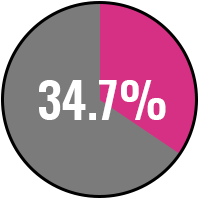
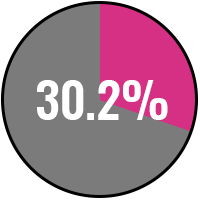
Over the course of a year, we see that the overall body of applications saw a statistically significant improvement in pass rate at the latest scan as compared to the initial scan pass rate.
OWASP Top 10 Policy Pass Rate: First Scan vs. Latest Scan
During the period covered by this report, the pass rate improved from 30.2% on initial scan to 34.1% in the latest scan (a 4 percentage point difference, but a 13% improvement rate). In other words, simply putting an application testing program in place can help an organization start chipping away at its flaws. This is further backed up by declining prevalence of the top 10 vulnerabilities in rescanned applications.
Improvement in Top 10 Vulnerabilities on Rescan
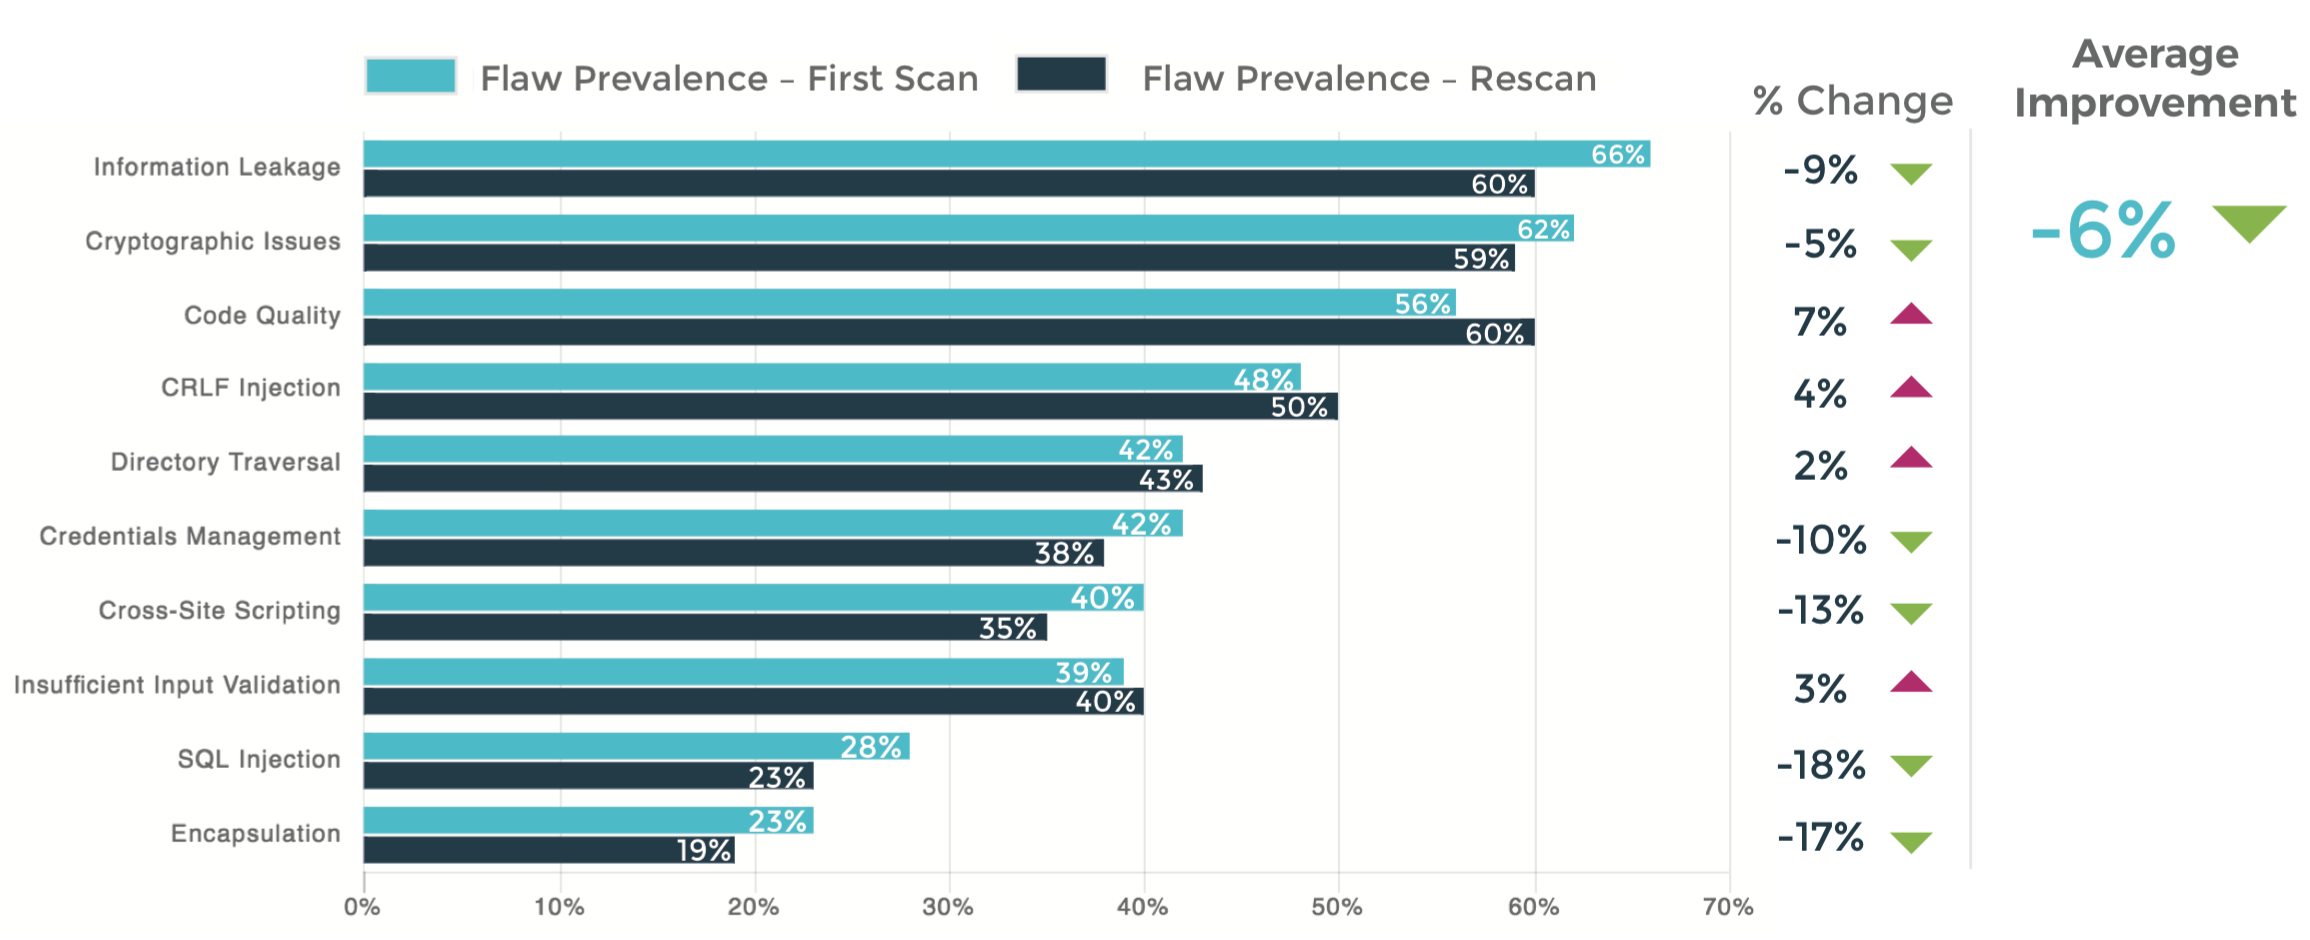
Some of the categories with the biggest decrease between initial scan and rescan were SQL injection (18% reduction in flaw incidence), encapsulation (17% reduction), and cross-site scripting (13% reduction). Not every category saw an improvement when we compared first scan to rescan – some saw small bumps upward in flaw incidence. There are a number of reasons for this – for example, the remediation process for other flaws could have potentially introduced other vulnerabilities elsewhere. However, across all of the top 10 vulnerability categories, our customers overall seem to have made progress by way of a 6% reduction in incidence of these vulnerability categories.
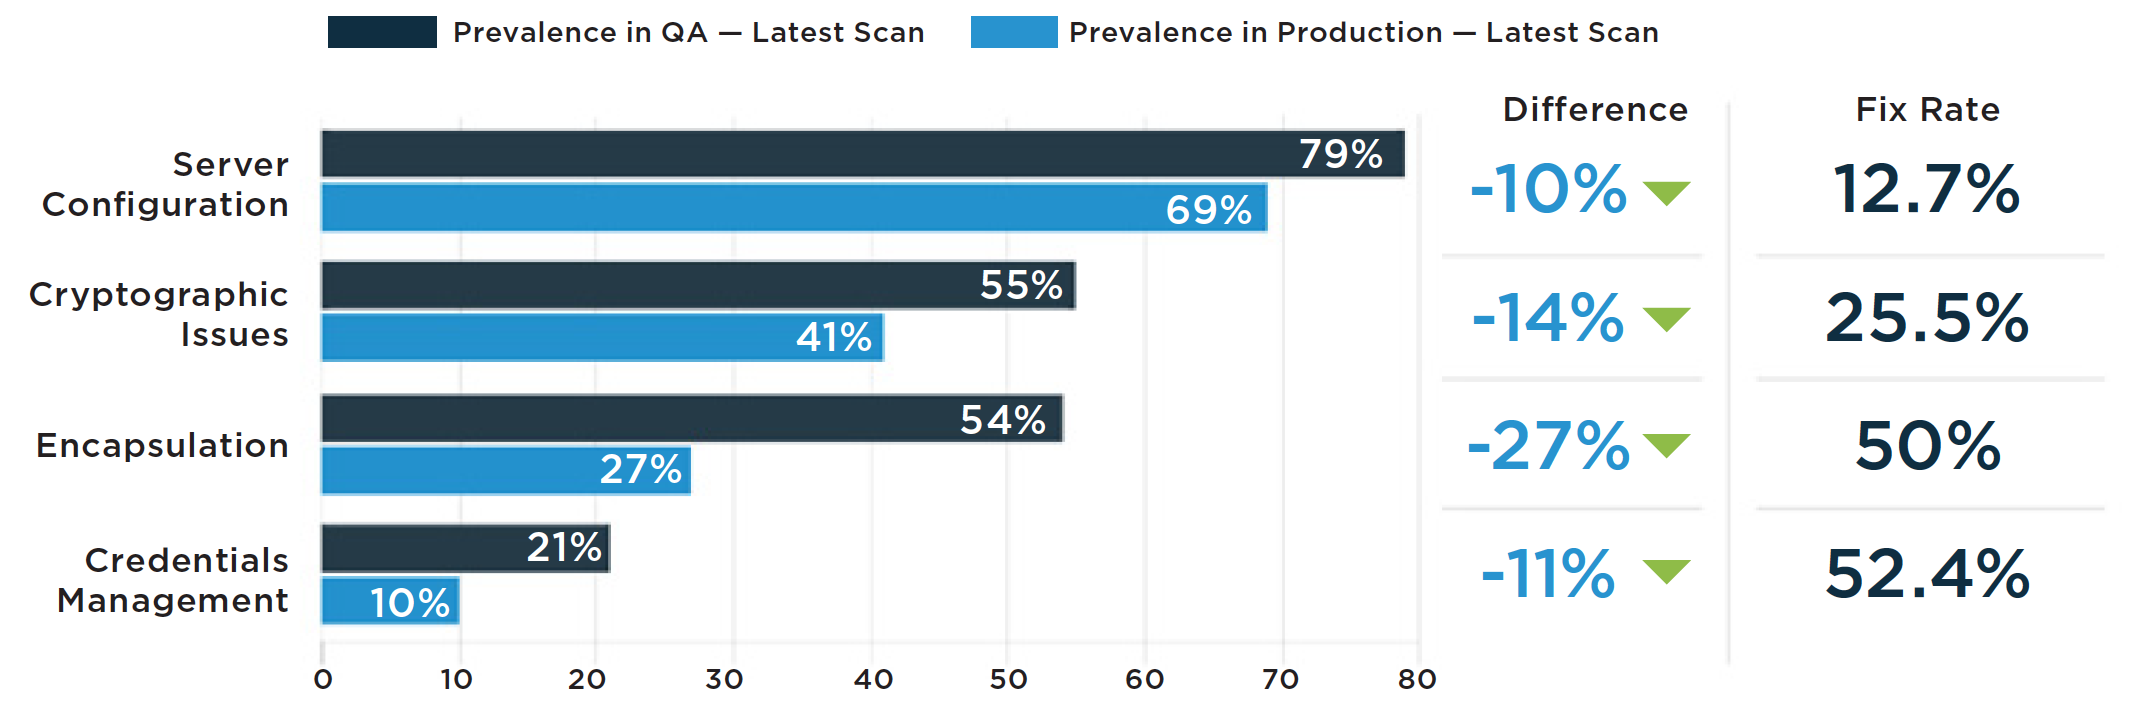
What matters most, however, is what kind of flaws make it into production, rather than how many of these flaws exist while the application is still in development and QA. This year we compared the incidence of the most common vulnerability types in both deployed applications and applications still in development. We did this by analyzing dynamic testing conducted on applications in a production environment versus those scanned in a pre-production environment behind a firewall.
Vulnerability Rates in Development vs. Production
Organizations that have been testing for 10 years had a 35% better all-time pass rate than those testing for a year or less.
The positive story here is that, for more than half the categories, organizations are making significant headway on reducing flaws in applications once they are deployed to production. The troubling element is that other significant categories go unchanged or even increase in prevalence in production. This could confirm the common complaint we hear from security teams that it is difficult for them to funnel requirements back into development once an application goes live. Frequently there's no active development team tasked with updating the application, meaning these flaws in production languish. Additionally, we've already noted that dynamic testing tends to dredge up different types of flaws. Dynamic testing also doesn't give developers the same code-level information that static testing provides, contributing to a longer remediation process.
The small overall gains in vulnerability prevalence in 2017 illustrate what veterans in the application security world have warned their bosses about for years now: it takes a while to get to OWASP compliance. This is no trivial effort. However, slow and steady progress can be maintained if organizations stick with it. Organizations that have been testing with Veracode since 2007 have a 35% better all-time OWASP Top 10 pass rate versus those who just started scanning this year (10 year-programs had a pass rate of 43% vs. 32% for first-year programs).
Application Security Program Maturity
OWASP Top 10 Pass Rate (All Time)
What Gets Fixed vs. What Really Matters
Overall pass rate improvement paints a basic picture of the state of software security. But ultimately, successful vulnerability management is all about prioritizing remediation based on risk. As such, we took a deep dive into the data that offers us a look at how well organizations are fixing the highest severity flaws.
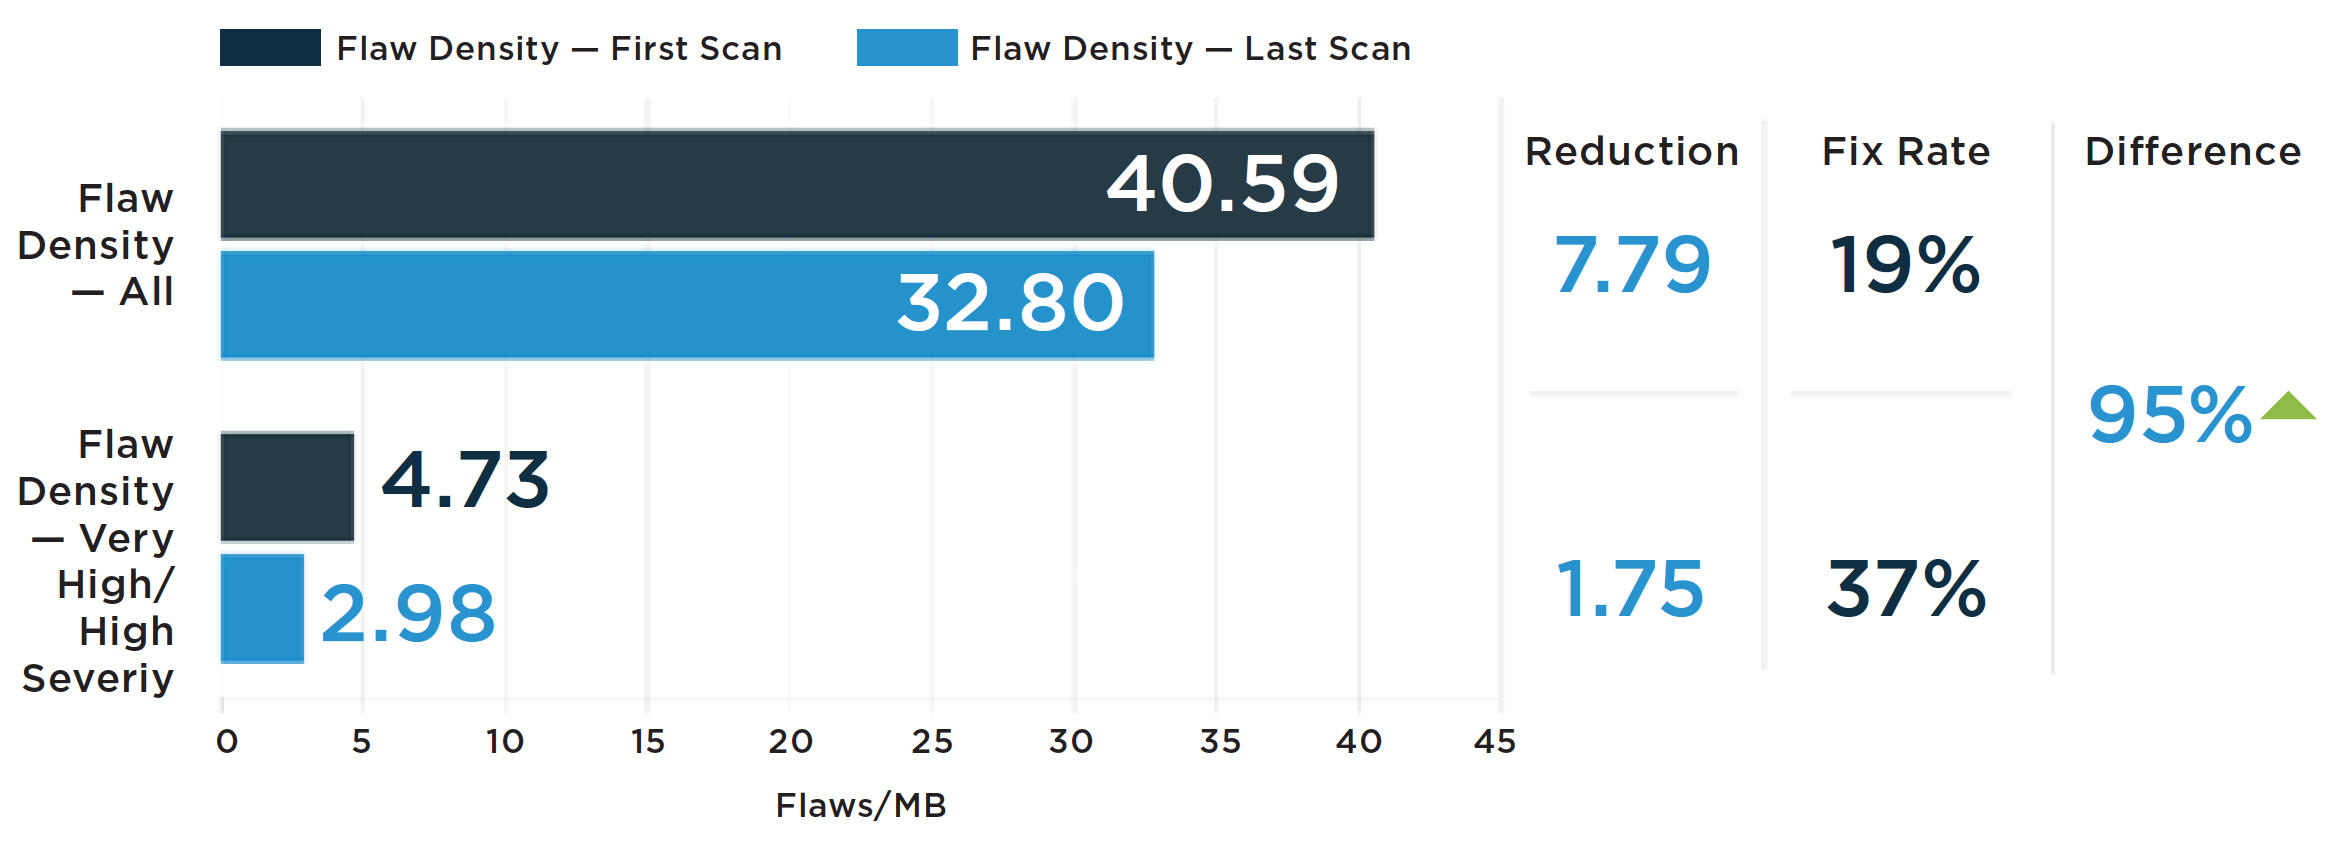
The numbers are quite promising. When comparing the fix rate of very high and high severity vulnerabilities (37%) to the overall fix rate (19%), we see that organizations are reducing the most severe flaws at about twice the overall fix rate.
Fix Rate of Very High / High Severity Vulnerabilities Compared With Overall Fix Rate
Slicing the numbers a different way, we find close to 77% of applications have at least one vulnerability (of any severity), on both initial scan and latest scan. It's pretty obvious what's going on with this lack of change: there's simply not enough bandwidth in IT to stamp out every single flaw within any given application. But rooting out high or very high vulnerabilities is definitely a worthy and often reachable goal, according to our statistics.
Applications With at Least One Vulnerability
Percentage of Applications
Comparing applications with at least one high or very high flaw at both initial scan and latest scan, we see that our customers made progress over the last year. The number of applications with high or very high severity vulnerabilities decreased by 26% between first and most recent scan.
Interestingly, though, the ratio of closed vs. open vulnerabilities in 2017 didn't track cleanly to the severity level of vulnerabilities.
Comparing Close Rate of Vulnerabilities by Severity
In other words, we did not find that organizations closed a higher percentage of the most severe vulnerabilities. Instead, the highest percentage of vulnerabilities closed were very low, the next most closed vulnerability severity were high and medium flaws, followed then by very high flaws and then low severity flaws. Informational flaws, which do not affect the overall security of an application, but may indicate some underlying problem that requires more investigation, were closed at the lowest rate.
Similarly, when you look at the time it took to close flaws by severity, the highest vulnerabilities were not necessarily closed the most quickly. Very high severity flaws tended to take the longest to close, with 62% of closed very high severity flaws taking longer than 90 days to close; 72% took longer than 46 days to close; and 76% took longer than 30 days to close.
Comparing Days to Close Flaws by Severity
Percentage of Closed Flaws
There are a number of explanations for this phenomenon. One is that many very high vulnerability flaws are also likely to be architectural flaws that are the thorniest to fix at the end of the development process or in production. Additionally, when we talk about prioritizing risk we must not only account for the severity of the flaw but the business value of the application at risk. Some organizations could also be potentially prioritizing a bigger chunk of high and medium flaws within higher value or more sensitive applications, compared to very high vulnerabilities in less sensitive applications.
Mitigation Reasons
Sometimes not all vulnerabilities closed are “fixed,” but are rather closed through mitigation. To understand why developers use mitigation to close flaws, rather than remediating flaws with a code fix, we looked at the logs for mitigation comments by developers.
Developers don't overwhelmingly reject static findings as false positives – they accept that the static analysis may be finding something. However, often developers have disagreements with static analysis based on different assumptions about how trustworthy their inputs are (e.g., databases and file stores). Other common points of friction include whether input from a third-party component may be trusted and whether functionality designed to be internal can be attacked.
Developer Mitigation Reasons
The DevOps Effect
Folding security into the DevOps ethos of incrementally improving software in smaller, faster builds gets the AppSec world closer to its most cherished goal: fixing flaws earlier in the development process. Increasingly, our data shows a shift towards the adoption of DevSecOps practices.
Scan frequency is a good litmus test for DevSecOps adoption. Infrequent testing likely indicates an organization scanning once or twice as an assurance gate at the end of a Waterfall development process. Meanwhile, very frequent application scans are a sign that an organization is engaging in Agile or DevOps software delivery patterns, where security is tested and refined while the developer works on features and other functional requirements.
The data we examined for this edition of SOSS indicates that most of our customers are scanning applications more frequently. Overall, the data shows applications scanned 12 or more times per year (or, monthly on average) rose in prevalence.
In particular, the ratio of applications scanned only once or twice a year shrank the most noticeably. While the ratio of applications scanned quarterly remained relatively flat, the percentage of applications scanned on a weekly basis showed the biggest gains compared to last year (with a relative increase of 50% year-over-year). While this is a bit of speculation, this could potentially show a move by those scanning once or twice per year moving up to a quarterly cadence, while those scanning quarterly have shifted up to monthly, every other week, or weekly scanning.
Scan Frequency
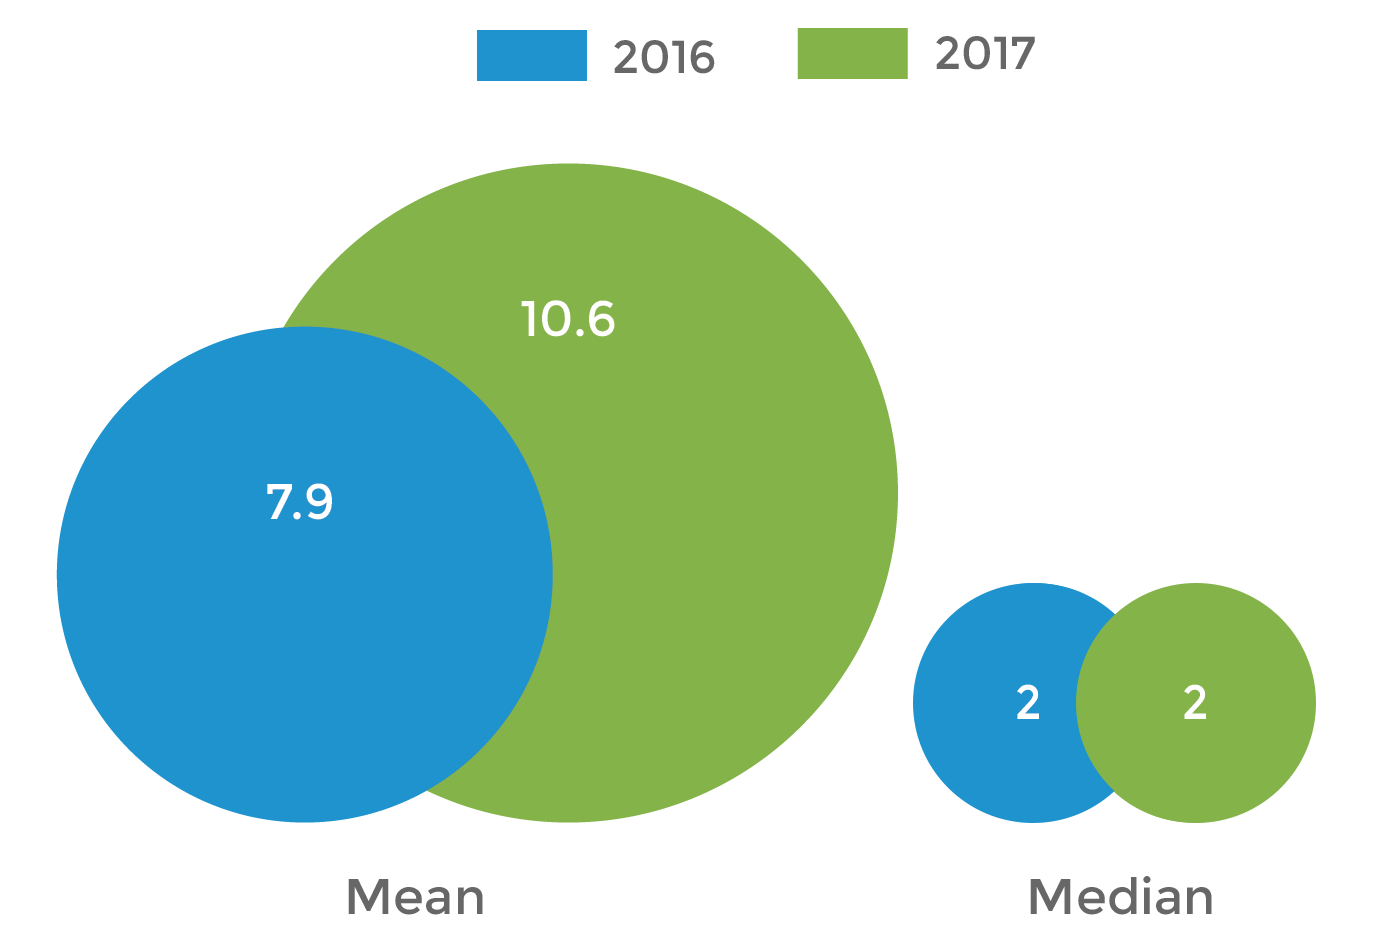
Clearly, the percentage of applications only scanned a handful of times per year still makes up the bulk of applications tested (72% were scanned 1-6 times, and 37% were scanned just once in a year). The median number of scans across all of the applications inspected by Veracode tests didn't budge – it stood fast at two scans per year. However, the organizations that are scanning more frequently are increasing the velocity of their cadence dramatically, with the mean number of scans per application shooting up from 7.9 in last year’s report to 10.6 this year.
Scans Per Application
All of these gains in scan frequency are translating to measurable gains in the overall security of the software undergoing more regular scrutiny. There's no definitive set of numbers in our SOSS data that ties the iterative DevOps practices back to improved fix rates, but what we do have is very promising.
In addition to the on-the-record “policy scans” that are used to track compliance of software prior to release, the Veracode Platform offers what we call “sandbox” assessments. These sandbox scans aren't tied to compliance metrics and their output is private to the developer, who can scan their code as many times in the sandbox as they want. They're available so developers can test unfinished code early in the process without worrying about security staffers knocking on their door when early numbers don't meet compliance benchmarks.
What we've found is that when organizations take advantage of sandbox testing, scan frequency increases, and the reductions in flaw density are striking.
Sandbox Scanning Impact on Fix Rate
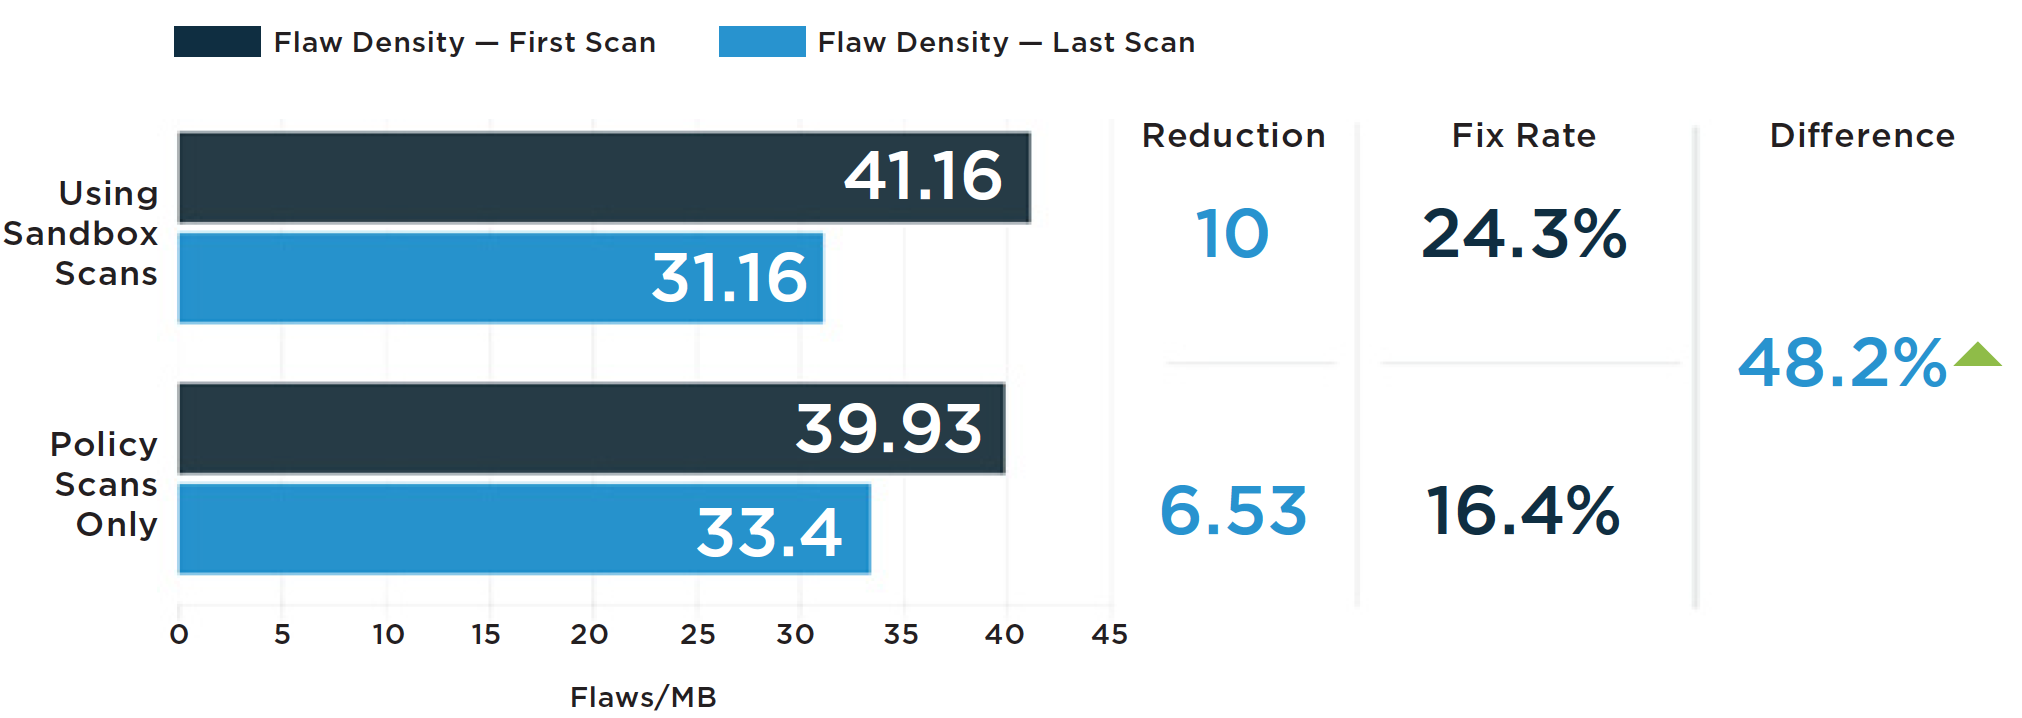
The difference between those organizations that use sandbox testing compared to those that only do policy scans translates to a 48.2% better fix rate when comparing flaw density changes from first scan to latest scan.
Watch: Tips for securing DevOps
CASE STUDY:
THE DEVOPS EFFECT

Anecdotally we have seen the relationship between more frequent scanning and improved application security play out dramatically. For instance, one financial services software company increased its scan rate by 70% in a four month period. In that same time, it managed to reduce the number of flaws reported within its software by 45%.
In another case, a software company started focusing on more frequent scans as part of an effort to integrate security into their continuous delivery software pipeline. Over the course of six months the firm grew the scanning frequency by 17.6% month-over-month. As a result the company increased the number of flaws fixed by 43.3% month-over-month.
Why is AppSec Still a Niche Discipline?
It's time to put the lazy developer trope to bed. It may be easy for cybersecurity pros to blame AppSec woes on indifferent, uncaring or slothful coders, but this hardly paints an accurate picture of what's really going on. And what's more, setting up this kind of adversarial dichotomy is hurting the security community's efforts to reach out to those closest to the development process.
The fact of the matter is that developers really do value security. According to the previously-mentioned survey we conducted with ESG, 62% of respondents said AppSec is very important to their development teams. Yet security may not be what developers’ bosses measure their performance on – just 18% in that same survey said security was the most important metric for measuring developers’ performance. What’s more, security education and ongoing training are not keeping up with the demand for secure coding skills. Veracode recently sponsored the 2017 DevSecOps Global Skills Survey from DevOps.com, and found that less than one in four developers or other IT pros were required to take a single college course on security. Meantime, once developers get on the job, employers aren't advancing their security training options, either. Approximately 68% of developers and IT pros say their organizations don't provide them adequate training in application security.
DEVELOPERS DON’T GET THE TRAINING THEY NEED
86%
of IT pros say their orgs don’t spend enough on AppSec training.
76%
say they weren’t required to take a course in security while in college.
68%
say their organizations don’t provide adequate AppSec training.
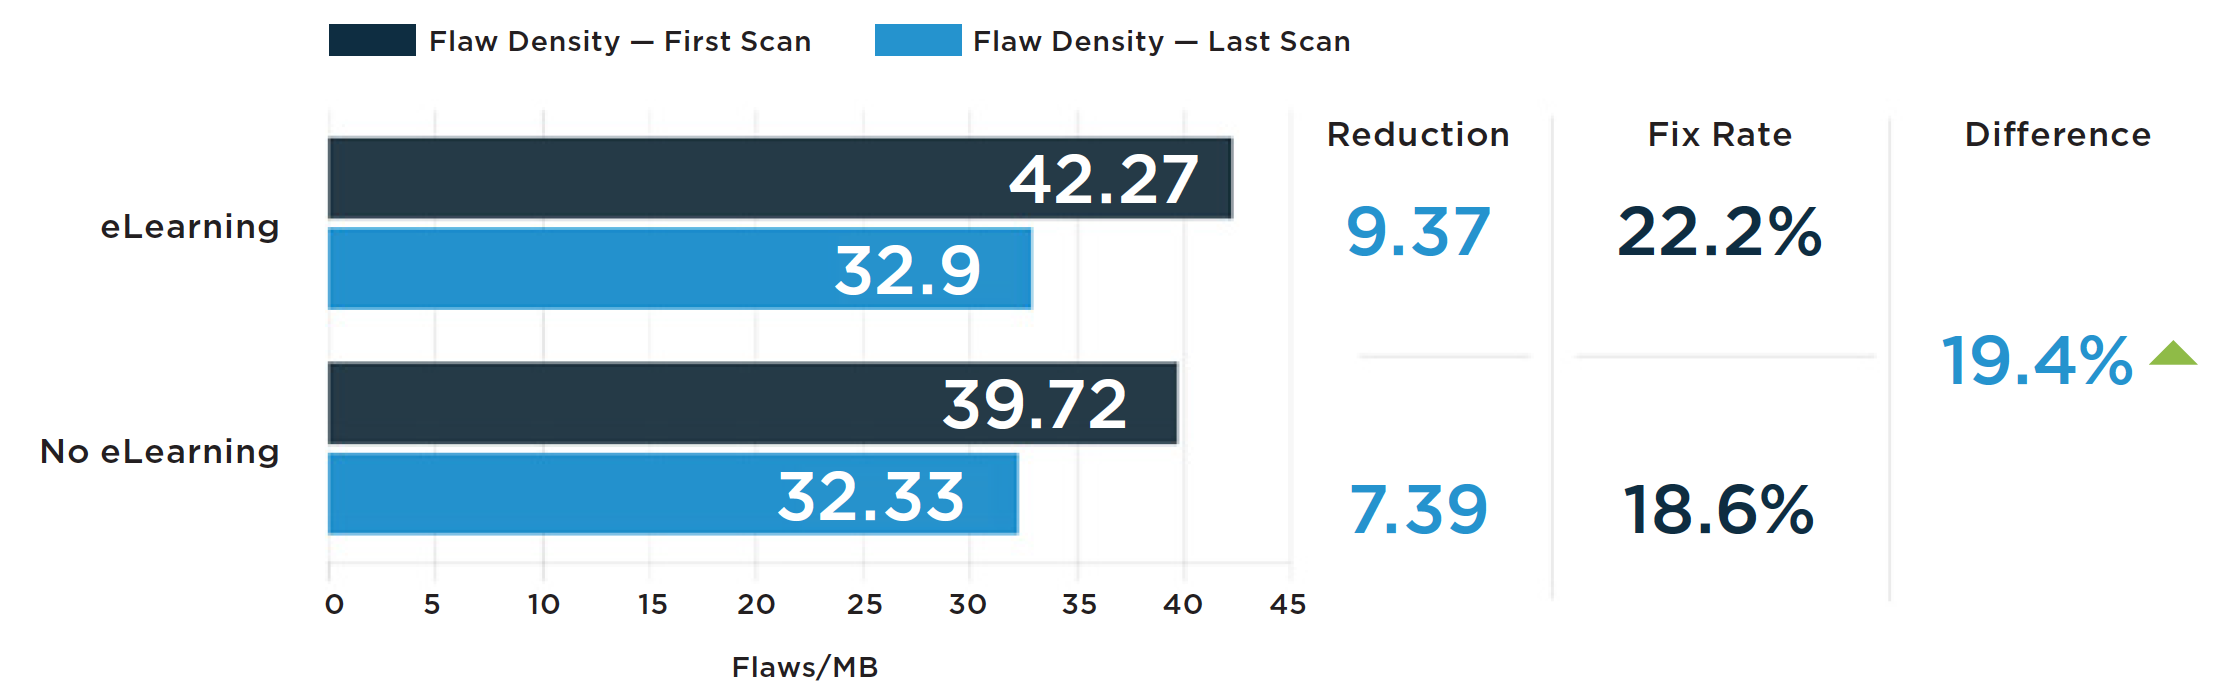
Despite the lack of resources for developers to boost their security skills, we’ve seen in our scanning data how additional developer resources can impact developers’ efficiency at fixing vulnerabilities. We’ve already discussed the effects of increased sandbox scanning on fix rates, but providing continuing education for developers on security topics also makes a statistically proven improvement in how well developers remediate flaws. When employers provide coders with opportunities to learn about application security through eLearning subscriptions, they stand to make a 19% improvement on fix rates.
eLearning Impact on Fix Rate
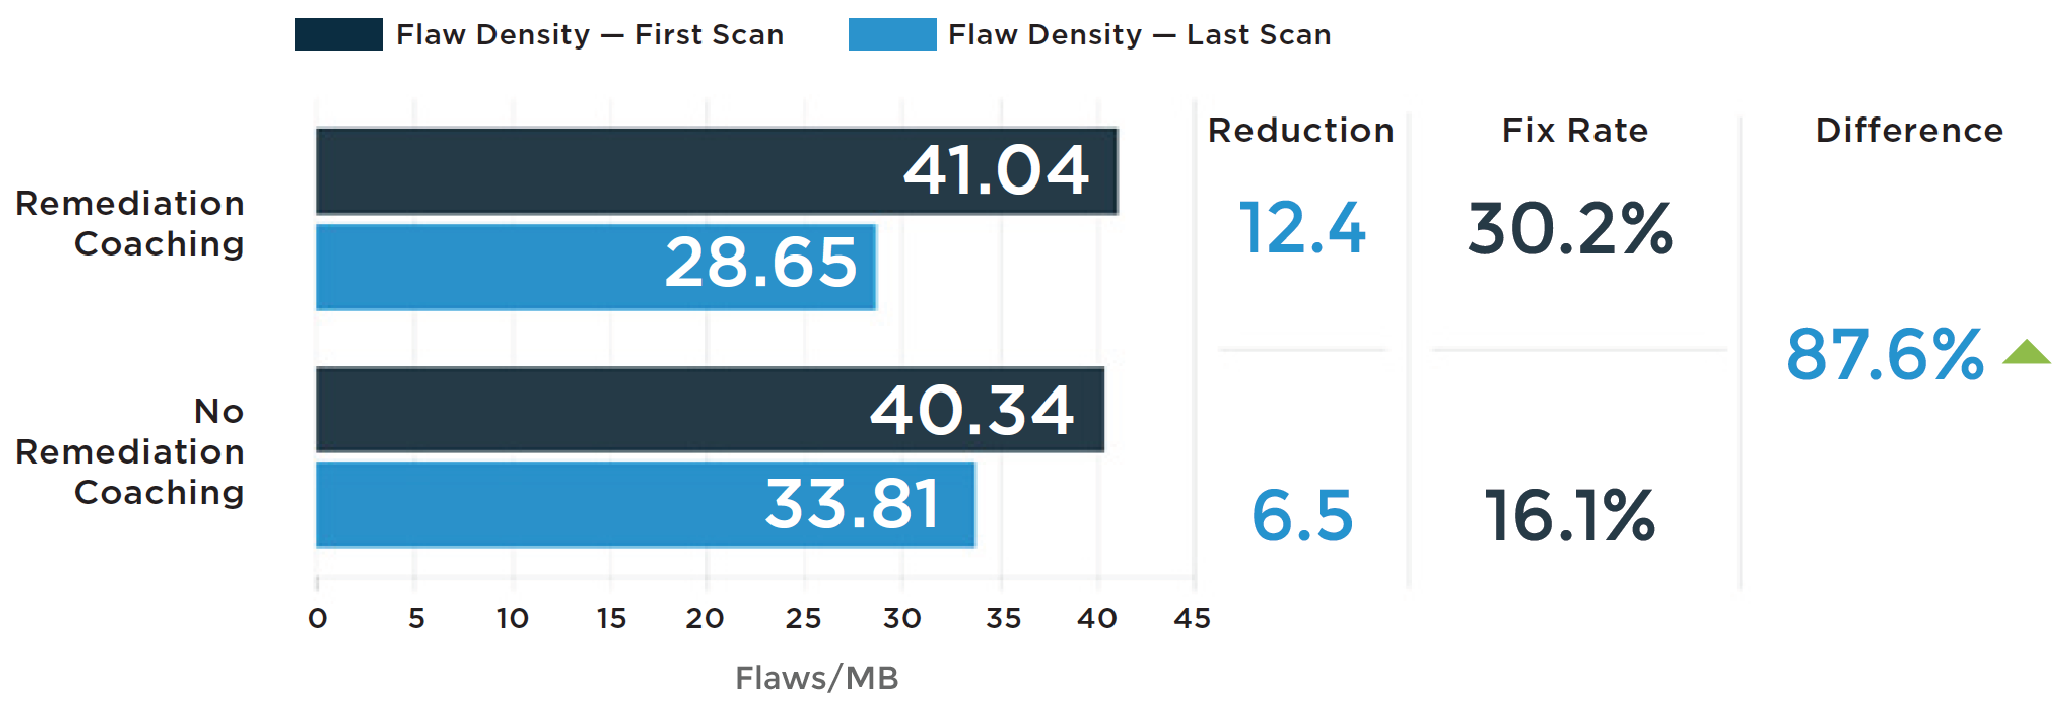
Another best practice is investment in remediation consulting. One of the big challenges with security testing is that developers frequently misinterpret scan results or have a difficult time planning the next steps for fixing a flaw once the results are made available. Organizations that pick up consulting services that offer analysis and advice to developers alongside the scan results show tremendous improvement in fix rates. The numbers this year show that remediation consulting can contribute to a whopping 88% improvement on an organization's fix rate.
Remediation Coaching Impact on Fix Rate
Clearly, if developers are given extra resources to accomplish their security goals, they will make progress on the flaw density in their software.
The big question left here is, what about integration of security tools with software development and delivery tools? The survey data we've collected in the past year has indicated that this stands as a stumbling block for improving the rate of security scanning in development shops. This year, we don't have the data to tie integration efforts back to remediation efficacy. But we're thinking about this metric and working on the instrumentation to measure it for future SOSS reports.
Watch: How to close the developer security skills gap
Ops People Impact AppSec, Too
It's also important to remember that developers are far from the only folks responsible for the overall vulnerability of an application to attacks. That's the whole point of the DevOps movement. We're all in this together in the struggle to improve software security, and that means that operations and other IT staffers play a big role in the process. That added dimension of responsibility has its own pros and cons. On one side, operations and IT staffers can help fix certain issues introduced by developers before applications go into production. But on the other side, ops people can introduce a host of other new problems into software.
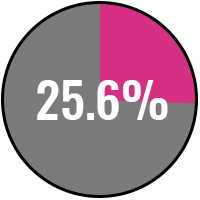
25% of responding sites were running on web servers containing at least one vulnerability with a CVSS score of 6 or higher.
For this year's SOSS report we took a look at the overall basic hygiene of the production environments on which applications run. What we found was that there were an alarming number of insecure servers running production software today. Even if these applications were flawless, they'd be vulnerable. We scraped this data by querying public-facing web applications on the companies' perimeters and logging what kind of messages servers responded with. These are the same kinds of responses that web applications would return to any browser or interested party requesting information from them – including malicious actors trolling for information about their targets.
One obvious best practice to prevent this kind of information leakage is to clean up server responses to hide all information about the server, or at least strip the server operating system version number from responses. Fortunately, about 37% of servers exhibited this kind of basic hygiene. The problem is that the next most prevalent response was from a web platform that's been around since 2009.
In fact, our examination found that 18.7% of sites were operating on web servers released a decade or more ago. And 25% of responding sites were running on web servers containing at least one vulnerability with a CVSS score of 6 or higher. Additionally, over a quarter of all sites responded with some sort of redirect, potentially indicating the use of shadow IT or sloppy IT practices.
Basic Hygiene: Top Server Responses to Discovery Queries
| Server Type | % of Web Servers | Security and Vulnerability Considerations |
| Apache, nginx, BigIP | 25% |
|
| Unknown | 12% |
|
| Microsoft-IIS/7.5 | 8% |
|
| Microsoft-IIS/6.0 | 5% |
|
| Apache/2.2.3 (Red Hat) | 4% |
|
| Squeegit/1.2.5 (3_sir) | 4% |
|
| Apache/2.4.7 (Ubuntu) | 4% |
|
| Microsoft-IIS/8.5 | 2% |
|
| Apache-Coyote/1.1 | 2% |
|
In spite of these signs of sloppy deployments that are putting apps at risk, many operations people are also making a positive impact on software in production. As we discussed in the What Gets Fixed vs. What Really Matters section of the report, dynamic testing shows that apps running in production did slightly better than those in pre-production. Digging deeper into these numbers, we uncovered that the categories with the biggest difference in vulnerability prevalence between development/QA and production were those that were most likely under the control of IT ops. So issues like easily guessable passwords and the wrong use of HTTP security headers that can be tackled by ops are likely to be shut down before they go live.
Production Fixes Most Likely to Be Impacted by Ops
Open Source Component Risk
Once again we examined the security of open source software components this year as a part of our SOSS analysis of Java applications. Though the results were slightly less dramatic than last year, they were nevertheless damning. In fact, we found that 88% of Java applications had at least one component-based vulnerability.
Java Applications With a Vulnerable Component
The crux of the issue appears to be that developers don't patch components in production once vulnerabilities are found and new versions of those components are released. In fact, according to our surveys over the past year, only 28% of organizations do any kind of regular composition analysis to understand which components are built into their applications. If more than two in three organizations don't even fully know which components they’re using, it's not hard to comprehend that so many of them remain unpatched.
In examining the most common Java components with high severity vulnerabilities (greater than a CVSS score of 6), we found quite a bit of turnover within the list from last year’s report. But it had less to do with patching and more with component feature upgrades, as well as newly found vulnerabilities that shook up the numbers.
Top Java Components With High Severity Vulnerabilities
| Rank | Component | Version | Prevalence in Java Applications | Position in SOSS 2016 |
| 1 | commons-collections-3.2.1.jar | 3.2.1 | 26.3% | 1 |
| 2 | commons-beanutils-1.8.3.jar | 1.8.3 | 12.8% | N/A |
| 3 | commons-collections-3.1.jar | 3.1 | 12.8% | N/A |
| 4 | commons-fileupload-1.2.jar | 1.2 | 12.2% | 5 |
| 5 | commons-collections-3.2.jar | 3.2 | 11.2% | N/A |
| 6 | xalan-2.7.0.jar | 2.7.0 | 8.5% | N/A |
| 7 | xalan-2.7.1.jar | 2.7.1 | 8.5% | N/A |
| 8 | commons-beanutils-1.8.0.jar | 1.8.0 | 7.7% | N/A |
| 9 | commons-fileupload-1.3.1.jar | 1.3.1 | 7.2% | N/A |
| 10 | commons-fileupload-1.2.1.jar | 1.2.1 | 7.1% | 2 |
| 11 | spring-core-3.0.5. RELEASE.jar | 3.0.5. RELEASE | 5.9% | N/A |
| 12 | commons-fileupload-1.2.2.jar | 1.2.2 | 5.8% | N/A |
| 13 | commons-beanutils-core-1.8.3.jar | 1.8.3 | 4.5% | N/A |
| 14 | struts.jar | 1.1 | 3.3% | N/A |
| 15 | spring-beans-3.0.5. RELEASE.jar | 3.0.5. RELEASE | 3.1% | N/A |
| 16 | batik-css-1.8.jar | 1.8 | 3.1% | N/A |
| 17 | commons-fileupload-1.0.jar | 1 | 2.9% | N/A |
“Struts-Shock” and the San Francisco Muni Attack
This is no theoretical problem anymore, either. Flaw-riddled components took center stage this past year as news broke of a number of high profile breaches caused by widespread vulnerabilities in open source or commercial components, including two big ones we analyzed. In March 2017, a number of high-profile targets got zapped by what we dubbed the "Struts-Shock" flaw. This critical vulnerability in the Apache Struts 2 library enables remote code execution (RCE) attacks using command injection, for which as many as 35 million sites were vulnerable. All it takes is a well-crafted web request to trigger the vulnerable code. The bad guys exploited the vulnerability in a range of victims’ applications, most notably the Canada Revenue Agency and the University of Delaware, in a breach of records that USA Today reported could cost the organization as much as $19 million.
According to our analysis, 68 percent of Java applications using the Struts 2 library were using a version vulnerable to Struts-Shock in the weeks following the initial attacks.
Struts-Shock: Struts 2 Versions in Use, March 2017

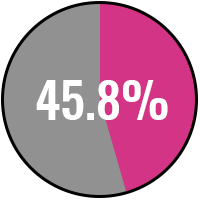
Just months before the Struts 2 zero-day attacks made waves, a ransomware attack against San Francisco Municipal Transportation Agency (SF Muni) likely targeting a deserialization flaw came into the limelight. This weakness was found in none other than Apache Commons Collections, a highly prolific component that is found seemingly everywhere in the Java world. Our figures show that approximately 53.3% of Java applications rely on Commons Collections versions (3.0 through 3.2.1 and 4.0) vulnerable to the deserialization flaw that left the SF Muni open to attack. Comparing the distribution of Commons Collections use this year to last year, we see more significant adoption of patched versions. And yet, a higher percentage of applications in 2017 were using vulnerable Commons Collections versions than in 2016, when 49% of applications had a vulnerable version.
Apache Commons Collections Versions Vulnerable to Deserialization Flaw

The silver lining to these notorious attacks is that they're driving increased attention about the practice of composition analysis and the security of the software supply chain. Sentiment gathered from our survey work in the last year shows that 38% of organizations are evaluating the benefits of composition analysis as we speak.
Watch: Best practices to reduce risk from components
CASE STUDY:
SECURING COMPONENTS
Corporate governance and oversight has historically proven to be the best means to minimize open source risk. Bringing a greater degree of discipline to tracking, managing, and updating open source components can make a huge difference in an organization’s overall application security risk posture.
This year we observed one of our global bank customers step up their efforts on this front to noticeable effect. The customer heavily invested in program management hours around component management and began generating regular reports to monitor open source components being deployed in hundreds of its applications. Over a six-month period, the firm successfully minimized open source exposure by reducing the number of applications with high-severity vulnerabilities in components by 13%.
Identity Management
The mantra of “identity as the new perimeter” grows more relevant by the day, with the network perimeter irrevocably dissolved and applications growing more connected than ever. CISOs increasingly look toward identity-centric security as a top concern right alongside application security. Security teams are investing in centralized identity and access management (IAM) to tie together the threads of access control across hybrid cloud environments, and to feed into more advanced security monitoring like user and entity behavior analytics (UEBA). But these risk management tools won’t be effective if the applications themselves have glaring flaws that put the assurance of access control in question. These worthwhile IAM initiatives could suffer from a very vulnerable AppSec Achilles heel.
The unfortunate fact of the matter is that, as IAM has grown in prominence among security leaders, so too has the prevalence of flaws that put identity controls at risk, particularly credentials management. Also keep in mind that this is data based on automated scanning. There are a limited number of authentication and authorization problems that can be found reliably via automation, so this represents just a subset of the potential risk in these areas.
Identity and Access Management Vulnerabilities in Applications
| Vulnerability Category | Credentials Management | Authentication | Authorization |
| Prevalence on First Scan | 42% | 2% | 2% |
| Types of Flaws |
|
|
|
Comparing Industry Performance
This year we carved up industry breakdowns slightly differently, with the changes most notable in two categories, infrastructure and government. Infrastructure is a new category grouping that we created based on organizations in energy, transportation, and utilities. Given the increased focus by the security community on improving the posture of assets in the critical infrastructure technology stack, we felt it was important to start tracking the state of software security in this grouping. Meanwhile, we massaged the government category to include federal, state, and local governments, as well as education organizations, under a single umbrella. As with the overall OWASP pass rate, industry pass rates upon initial scan are down considerably across the board in 2017.
Industry Comparison: OWASP Pass Rates
| Industry | OWASP Pass Rate 2017 – First Scan | OWASP Pass Rate 2016 – First Scan | Percent Change |
| Infrastructure | 29.8% | N/A | N/A |
| Manufacturing | 28.9% | 38.7% | -25% ▼ |
| Healthcare | 27.6% | 33.3% | -17% ▼ |
| Retail & Hospitality | 26.2% | 37.6% | -30% ▼ |
| Tech | 25.4% | 38.1% | -33% ▼ |
| Financial Services | 25.1% | 39.1% | -35% ▼ |
| Government | 23.5% | 25.1% | -6% ▼ |
| Other | 25.8% | 40.7% | -37% ▼ |
| Overall | 30.2% | 38.6% | -22% ▼ |
Most industry groups underperformed compared to the overall OWASP pass rate benchmark this year, although the newly organized infrastructure category, manufacturing, and healthcare came within a couple percentage points of the benchmark. Those looking for silver linings will also note that the lowest performing industries in last year’s SOSS study, government and healthcare, experienced the smallest declines in pass rates year-over-year. That lining may be the merest of slivers for government, when you start looking at incidence of some of the major vulnerability categories on first scan.
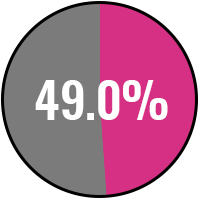
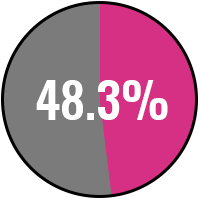
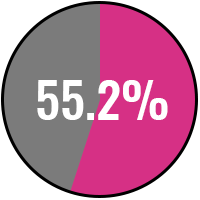
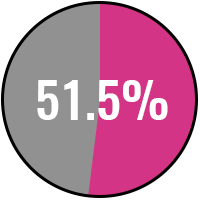
Industry Comparison: Major Vulnerability Categories
Percentage of Applications Affected
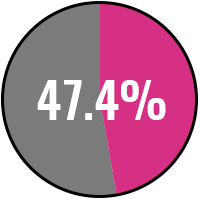
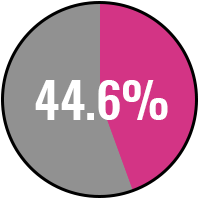
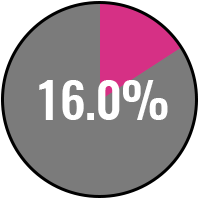
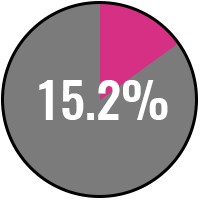
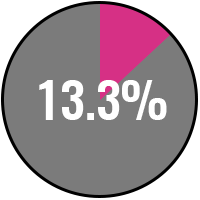
| Industry | Cross-Site Scripting | SQL Injection | Credentials Management | Cryptographic Issues |
| Financial Services | 29.0% | 19.3% | 28.4% | 43.5% |
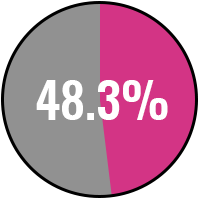
| Government | 49.0% | 31.5% | 32.7% | 48.3% |
| Healthcare | 34.8% | 25.4% | 32.7% | 51.5% |
| Infrastructure | 21.4% | 9.0% | 21.4% | 24.3% |
| Manufacturing | 19.3% | 9.9% | 18.8% | 30.2% |
| Retail & Hospitality | 28.5% | 19.3% | 30.1% | 44.6% |
| Tech | 8.6% | 6.6% | 10.3% | 16.0% |
| Other | 12.8% | 8.3% | 13.7% | 20.4% |
The numbers for vulnerability prevalence on first scan shows that government was in worst place in nearly every category. The only exception was cryptographic issues, for which healthcare showed up in last place. On the other hand, the technology sector showed amazing performance for these major vulnerability types. This chart offers a glimpse primarily at vulnerabilities that are still in the development process, so there is a ray of hope here given how much less prevalent these vulnerabilities are than in the overall data set, which includes production applications.
When we add latest scan pass rates into the mix, we do see a modest increase in applications passing policy. Interestingly, while infrastructure performed best on first scan, and was in the middle of the road with latest scan numbers, its pass rate numbers remained essentially flat from first to latest scan. This could potentially indicate problems in infrastructure organizations’ ability to remediate found vulnerabilities, which mirrors industry hearsay about the challenges around improving the posture of legacy software like SCADA systems. As this was our first year analyzing infrastructure industry data, we’ll be sure to monitor this critical area in future reports to pick up on trends.
Industry Comparison: First and Last Scan
| Industry | OWASP Pass Rate 2017 – First Scan | OWASP Pass Rate 2017 – Last Scan | Percent Change |
| Infrastructure | 29.8% | 29.5% | -1% ▼ |
| Manufacturing | 28.9% | 30.5% | 6% ▲ |
| Healthcare | 27.6% | 30.2% | 9% ▲ |
| Retail & Hospitality | 26.2% | 28.5% | 9% ▲ |
| Tech | 25.4% | 26.1% | 3% ▲ |
| Financial Services | 25.1% | 26.7% | 6% ▲ |
| Government | 23.5% | 24.7% | 5% ▲ |
| Other | 25.8% | 26.6% | 3% ▲ |
| Overall | 30.2% | 34.1% | 13% ▲ |
This year we also took a peek at how many applications within an industry were undergoing their first policy scan as compared to the rest of the portfolio under current testing. A higher percentage of new applications undergoing their first policy scan tends to suggest that those organizations are getting started in the application security maturity process.
Industry Comparison: New Applications Under Testing
| Industry | Percentage of Applications Having First Policy Scan |
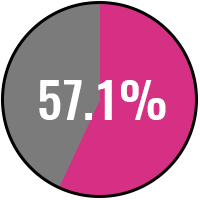
| Retail & Hospitality | 67.8% |
| Healthcare | 62.0% |
| Infrastructure | 57.5% |
| Tech | 50.5% |
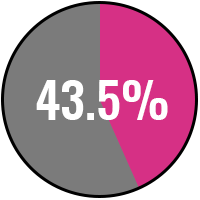
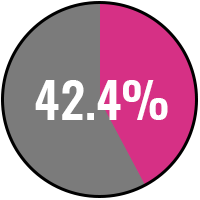
| Financial Services | 43.5% |
| Manufacturing | 39.1% |
| Government | 37.6% |
| Other | 60.3% |
Similarly, a lower number of applications getting their first scan could indicate that customers in this grouping have already covered a lot of their portfolio and are further along on the maturity curve. However, it could also indicate that the industry is struggling to remediate the applications it already has under testing and doesn't want to add any further tests until it can prioritize fixes in its existing portfolio.
For example, though it is historically one of the most mature sectors in application security, financial services is pretty low on the list. But it is not the absolute lowest when it comes to on-boarding applications – government is. Given government's annual worst place position in OWASP pass rates in our SOSS reports, it is probably understandable why these organizations are hesitant to expand their portfolio under test.
Meanwhile, healthcare and retail/hospitality on-boarded the most applications relative to the size of their portfolios. This could go a long way toward explaining their good performance in remediation from first scan to latest scan. With so many new applications added, these industries likely were able to take care of a lot of low-hanging fruit, namely easy-to-fix flaws that were newly found. Next up, we’ll take a deeper dive at some key statistics in each of the major industry categories.
Industry Sectors at a Glance
We used several key metrics to benchmark industry performance, including OWASP pass rate, improvement between first and latest scan, and percentage of new applications under test during the examination period. In addition to comparing industries with each other, it's also useful to look at the performance of industries against the overall average of organizations of any industry. Here we provide a snapshot of each of the seven major industries we studied.

Rank by OWASP Pass Rate
(Latest Scan)
5
Rank by First Scan/Latest Scan Improvement
3
Rank by Percentage of New Applications Under Test
5

OWASP PASS RATE — LATEST SCAN
Services


TOP THREE VULNERABILITY TYPES
Percentage of Applications Affected
Information Leakage
Cryptographic Issues
Code Quality

FREQUENCY OF TESTING
| Daily | At Least Weekly | At Least Monthly | At Least Quarterly | Less Than Quarterly | |
| Financial Services | 2% | 11% | 22% | 13% | 52% |
| Overall | 1.3% | 8.2% | 18.8% | 12.5% | 59% |

Flaw Density
Flaws per MB (First Scan)
125.43
15.54

Rank by OWASP Pass Rate
(Latest Scan)
7 (last)
Rank by First Scan/Latest Scan Improvement
5
Rank by Percentage of New Applications Under Test
7 (last)
OWASP PASS RATE — LATEST SCAN


TOP THREE VULNERABILITY TYPES
Percentage of Applications Affected
Information Leakage
Cryptographic Issues
Code Quality
FREQUENCY OF TESTING
| Daily | At Least Weekly | At Least Monthly | At Least Quarterly | Less Than Quarterly | |
| Government Overall | 0% | 4% | 21% | 24% | 51% |
| 1.3% | 8.2% | 18.8% | 12.5% | 59% |
Flaw Density
Flaws per MB (First Scan)
103.36
8.34

Rank by OWASP Pass Rate
(Latest Scan)
2
Rank by First Scan/Latest Scan Improvement
1
Rank by Percentage of New Applications Under Test
2
OWASP PASS RATE — LATEST SCAN

TOP THREE VULNERABILITY TYPES
Percentage of Applications Affected
Information Leakage
Cryptographic Issues
Code Quality
FREQUENCY OF TESTING
| Daily | At Least Weekly | At Least Monthly | At Least Quarterly | Less Than Quarterly | |
| Healthcare Overall | 1% | 6% | 10% | 11% | 73% |
| 1.3% | 8.2% | 18.8% | 12.5% | 59% |
Flaw Density
Flaws per MB (First Scan)
59.20
6.97

Rank by OWASP Pass Rate
(Latest Scan)
3
Rank by First Scan/Latest Scan Improvement
7 (last)
Rank by Percentage of New Applications Under Test
3
OWASP PASS RATE — LATEST SCAN

TOP THREE VULNERABILITY TYPES
Percentage of Applications Affected
Information Leakage
Cryptographic Issues
Code Quality
FREQUENCY OF TESTING
| Daily | At Least Weekly | At Least Monthly | At Least Quarterly | Less Than Quarterly | |
| Infrastructure Overall | 1% | 8% | 18% | 10% | 64% |
| 1.3% | 8.2% | 18.8% | 12.5% | 59% |
Flaw Density
Flaws per MB (First Scan)
219.94
2.50

Rank by OWASP Pass Rate
(Latest Scan)
1
Rank by First Scan/Latest Scan Improvement
4
Rank by Percentage of New Applications Under Test
6
OWASP PASS RATE — LATEST SCAN

TOP THREE VULNERABILITY TYPES
Percentage of Applications Affected
Information Leakage
Cryptographic Issues
Code Quality
FREQUENCY OF TESTING
| Daily | At Least Weekly | At Least Monthly | At Least Quarterly | Less Than Quarterly | |
| Manufacturing Overall | 0% | 6% | 21% | 13% | 59% |
| 1.3% | 8.2% | 18.8% | 12.5% | 59% |
Flaw Density
Flaws per MB (First Scan)
462.61
7.83

Rank by OWASP Pass Rate
(Latest Scan)
4
Rank by First Scan/Latest Scan Improvement
2
Rank by Percentage of New Applications Under Test
1
OWASP PASS RATE — LATEST SCAN

TOP THREE VULNERABILITY TYPES
Percentage of Applications Affected
Information Leakage
Cryptographic Issues
Code Quality
FREQUENCY OF TESTING
| Daily | At Least Weekly | At Least Monthly | At Least Quarterly | Less Than Quarterly | |
| Retail & Hospitality Overall | 1.5% | 7.3% | 17.9% | 14% | 59.3% |
| 1.3% | 8.2% | 18.8% | 12.5% | 59% |
Flaw Density
Flaws per MB (First Scan)
74.85
8.75

Rank by OWASP Pass Rate
(Latest Scan)
6
Rank by First Scan/Latest Scan Improvement
6
Rank by Percentage of New Applications Under Test
4
OWASP PASS RATE — LATEST SCAN

TOP THREE VULNERABILITY TYPES
Percentage of Applications Affected
Information Leakage
Cryptographic Issues
Code Quality
FREQUENCY OF TESTING
| Daily | At Least Weekly | At Least Monthly | At Least Quarterly | Less Than Quarterly | |
| Tech Overall | 2% | 6% | 15% | 11% | 67% |
| 1.3% | 8.2% | 18.8% | 12.5% | 59% |
Flaw Density
Flaws per MB (First Scan)
170.99
19.08
This year's SOSS report offers a lot of food for thought on where we need to go to continue moving the needle on application security. Some bright spots from the report show that those organizations that do testing and remediation are prioritizing the worst vulnerabilities, reducing flaw density on very high and high severity flaws at twice the clip of the overall field of vulnerabilities. Nevertheless, only 14% of the most severe flaws are fixed in under a month, and nearly 12% of applications have at least one high or very high severity flaw. If organizations are going to drive down the risk of security bugs in the software we all depend upon, they're going to need to fight to bring at least the very worst bugs under better control, and with haste. Yet, there are some best practices we’re able to identify through our examination of the data. Here are some of the key findings you should take with you in order to make progress in the coming year.

You Can't Improve Security Without Testing
When developers don't use security testing to spot check their work, they're introducing flaws into their code at an alarming rate. Time and again we find that about two-thirds of previously untested applications fail to meet security standards the first time they're scanned for vulnerabilities. The obvious takeaway here is that if you’re going to start making a dent in vulnerabilities, you need to start by finding them. Seems obvious, but many organizations are just starting out with application security testing or aren't testing applications at all.

Stick With the Program
Obviously, testing software is just the first step toward eliminating vulnerabilities. You need to actually do something about these flaws once they're uncovered. This means developing a systematic application security program, with standardized procedures for prioritizing and remediating vulnerabilities according to risk. But don't expect big-bang improvement from these programs – progress is slow and steady. The lesson from this year's data is that you have to stick it out. The longer a program is in place, the more cumulative progress you will make on metrics like OWASP pass rates.

Test Early and Often
One-and-done testing may tick off the box for compliance purposes, but if you want to make true headway into fixing problems, it's going to take more effort than that. Our statistics in these year's SOSS report show that the more frequently organizations test their applications, the better they are at fixing flaws. This goes hand-in-hand with DevOps practices, which support the security ideal of shifting remediation earlier in the development process by making incremental improvements through smaller, faster builds. Equipping developers with testing technologies accessible within their environments will help you shift DevOps to DevSecOps.

Give Developers the Resources They Need
As DevOps practices continue to take hold in IT shops today, security teams are increasingly filling the role of expert consultants and partners rather than testers and compliance babysitters. This means developers are shouldering more responsibilities both during security testing and remediation. Security pros should be doing all they can to help developers understand test results and strategize remediation efforts. Our data shows that supporting developers with resources such as eLearning and remediation coaching can have a tremendous impact on the efficacy of developer teams in fixing security bugs.

Fix What You Can, Starting With What Matters Most
For the first time, this year’s SOSS report looked at time-to-close vulnerabilities, including by severity. What we found was instructive – and largely positive. Our data indicates that organizations are prioritizing the most severe vulnerabilities for remediation, fixing high and very high severity vulnerabilities at twice the overall fix rate. Still, there is much room for improvement in fixing “what really matters.” Only a small slice of very high severity flaws are closed within 30 days, and the bulk of high and very high severity flaws take more than 90 days, giving attackers ample time to discover them. Although it would be a mistake to think that just because vulnerabilities are rated at a medium or low severity, that you should let them slide, the approach of fixing the most serious vulnerabilities first is a wise one.

Reduce Risk From Vulnerable Components
As the “Struts-Shock” attacks from early 2017 demonstrated, vulnerabilities in open source components are highly likely to be exploited. That’s because attackers know that a single vulnerability can be found in a wide range of applications, and organizations frequently aren’t aware that they are vulnerable. Open source and third party components aren’t necessarily less secure than code you develop in-house, but keeping an up-to-date inventory of what versions of a component you are using, and where, can be tricky. Our data shows that organizations are frequently failing in this area – 88% of Java applications have at least one component-based vulnerability. Using software composition analysis at the same time as you conduct static application scanning greatly reduces your risk by identifying components with a known vulnerability.
Appendix
Click to Open ▼
Methodology
About the dataset
Beginning with this volume of State of Software Security, Veracode shifts methodology to using a 12 month sample window. The data represents 397,140 application assessments submitted for analysis during the 12 month period from April 1, 2016, through March 31, 2017, except for the time-to-close flaws data, which covers the period of January 1, 2016, to December 31, 2016. The data represents large and small companies, commercial software suppliers, open source projects, and software outsourcers. In most analyses, an application was counted only once, even if it was submitted multiple times as vulnerabilities were remediated and new versions uploaded.
The report contains findings about applications that were subjected to static analysis, dynamic analysis, software composition analysis, and/or manual penetration testing through Veracode’s cloud-based platform. The report considers data that was provided by Veracode’s customers (application portfolio information, such as assurance level, industry, application origin) and information that was calculated or derived in the course of Veracode’s analysis (application size, application compiler and platform, types of vulnerabilities, and Veracode Level – predefined security policies which are based on the NIST definitions of assurance levels).
Industry Verticals
This report condenses information about applications coming from 38 different industry classifications into seven industry verticals, plus a bucket for “other.” The component industry classifications come from Data.com via Salesforce.com, but Veracode has created the industry verticals below to simplify the analysis. This year's State of Software Security report adds a new industry vertical grouping for infrastructure, based on increased sample size in these industries (previously included in “other”), and due to increased attention to security in the component industries. In this year’s report, education organizations were added to the government industry vertical. A mapping of the component industries to industry verticals is provided below.
Industry Vertical
Component industries as defined in Data.com
FINANCIAL SERVICES
Banking, Finance, Insurance
Government
Government, Education
Infrastructure
Energy, Transportation, Utilities
Other
Biotechnology, Entertainment, Not for Profit, Apparel, Communications, Engineering, Media, Media & Entertainment, Food & Beverage, Machinery, Construction, Chemicals, Shipping, Business Services, Automotive & Transport, Beverages, Recreation, Real Estate, Membership Organizations, Environmental, Consumer Services, Not Specified, Other
Manufacturing
Manufacturing, Aerospace
Retail &
Hospitality
Retail, Hospitality
Technology
Technology, Telecommunications, Electronics, Software, Security Products and Services, Consulting, Computer Hardware
ABOUT VERACODE
Veracode, CA Technologies’ application security business, is a leader in helping organizations secure the software that powers their world. Veracode’s SaaS platform and integrated solutions help security teams and software developers find and fix security-related defects at all points in the software development lifecycle, before they can be exploited by hackers. Our complete set of offerings help customers reduce the risk of data breaches, increase the speed of secure software delivery, meet compliance requirements, and cost effectively secure their software assets – whether that’s software they make, buy or sell. Veracode serves over a thousand customers across a wide range of industries, including nearly one-third of the Fortune 100, three of the top four U.S. commercial banks and more than 20 of the Forbes 100 Most Valuable Brands. Learn more at veracode.com, on the Veracode Blog, and on Twitter.